An introduction to percentile scores: What are they, and what are the benefits?
HR professionals often face the challenge of hiring for diverse roles, many of which they might not be intimately familiar with. In a week, you might have ongoing processes for a software engineer, a marketing coordinator, and a graphic designer. It can be difficult to know, understand, and apply criteria and standards that are a) role-specific and suited to your organization and b) broad enough to have universal relevance.
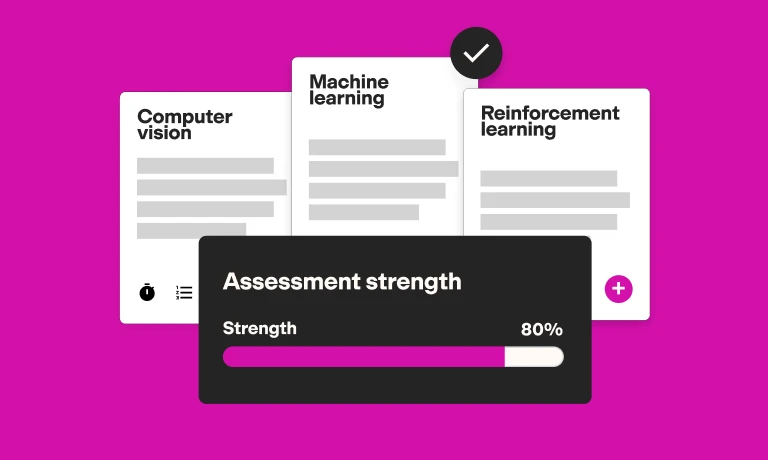
That’s where TestGorilla assessments step in, helping you evaluate both the soft and hard skills essential for these roles. But interpreting assessment and test scores can be a difficult task. Is a 55% score on a Machine learning test good? And what about a Data Science test? Is a 65% score much better than a 55% score? Or only slightly better? These all are difficult questions.
Percentile scores help you navigate and answer those questions easily. They ensure clarity by showing how a candidate’s performance stacks up against others. This makes it is easier to understand and compare results across different candidates and assessments.
In this science series blog, we’ll cover the definition and benefits of percentile scores to help you understand why we use them at TestGorilla. Let’s dive in.
What are percentiles?
Percentiles are a type of scoring metric that helps you understand candidate performance in comparison to others. For example, a candidate scoring in the 54th percentile is a candidate who did better on the test than 54% of other candidates in our reference group test. Note that this is different from a candidate scoring 54% of correct answers on a test.
The alternative to percentile scoring is a a percent correct score. To stick with our example, scoring 54% of correct answers simply means that the candidate answered a certain number of questions correctly. It doesn’t take into account the difficulty or similarity of those questions, which makes it much easier to overlook good candidates.
With a percent correct score, there’s no way to know whether the 54% is because the candidate did well on the important difficult questions, or because they aced all the easy questions that a highly skilled candidate might find distracting. Additionally, comparing results across assessments can be tricky with percent correct scores, as tests of the same skill across assessments will have different questions.
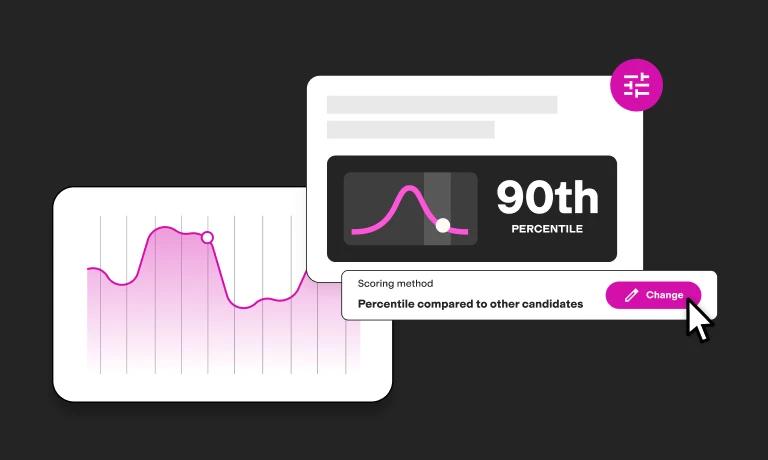
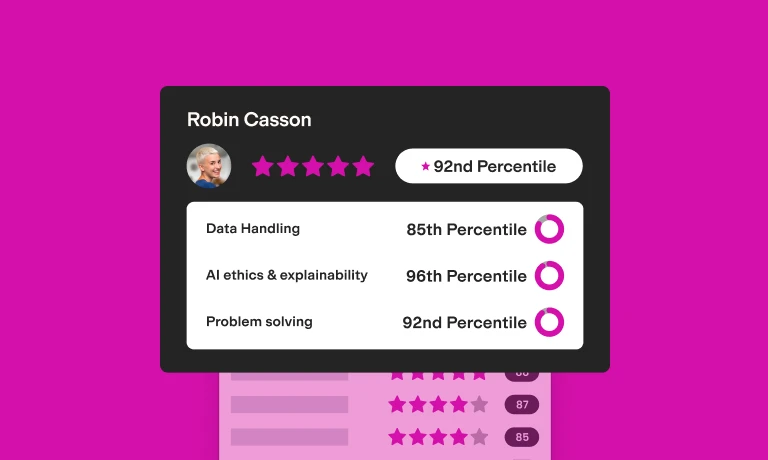
The percentile score is a single number that combines information about the candidate’s answers and question difficulty. This makes it easy to differentiate between good, great, and excellent candidates. It also enables you to compare candidates across different assessments, as the percentile score already weighs in the question and test difficulty. When a developer scores in the 90th percentile on a Javascript test, that means they showed better performance than 90% of other candidates who took it.
While a 90% correct score on a difficult test might mean a lot, a 90% score on an easy one doesn’t mean as much. A result in the 90th percentile always means the same – that a candidate is better than 90% of others who took the test. This makes it possible to rank and compare candidates without pondering the individual questions, their differences, and their difficulties.
Percentile scoring 🤝 candidate screening
Tests used in candidate screening are fundamentally different from those typically encountered in educational settings.
While the percent correct score on a test is useful for a teacher checking if their students went through all of the materials, it is less useful for recruiters. After all, recruiters are usually not looking to check whether a candidate knows a specific definition, but are looking to understand who in their talent pool can deliver the best performance in the future. Percentile scores enable you to do just that, providing a neat and efficient way to communicate how a candidate ranks against others who took the test.
Percentile scoring in TestGorilla’s assessments
TestGorilla’s approach to percentiles is designed to enhance your hiring decisions by making them more precise and tailored to your needs.
Accounting for question difficulty
At the test level, we account for the difficulty of individual questions. Consider two candidates: one might answer easier questions correctly, while the other tackles harder ones. Our system adjusts their scores accordingly.
This is done by weighing the correct answers with the parameter describing the questions’ difficulty. Question difficulty is calculated by looking at the performance in the reference sample and calculating how likely it is for the average candidate to answer the question correctly.
A question with 0.8 difficulty, for example, is a question that 80% of candidates can answer correctly, meaning that it is easy. A question with 0.2 difficulty is a hard question, and only 20% of people can answer it correctly. This information is then used to give a higher “score” to the difficult question than the easy one.
Z-scores
To refine this further, we calculate z-scores, which describe the candidate’s performance in comparison to the reference group.
These scores describe how far away is the result of a given candidate from the mean score of the whole group. Z-scores always have an average of zero and a standard deviation of 1.0 and offer a standardized way to compare results across different assessments, accounting for variations in question difficulty and test design. Finally, these z-scores are converted into percentiles, which provide a clear, relative ranking of a candidate's performance. A candidate with a z-score of 0.4, for example, falls into the 66th percentile, indicating they outperformed 66% of the reference group.
This combined approach ensures that candidate scores reflect not just the number of correct answers, but also the relative difficulty of those questions and how the candidate stands against others.
At the assessment level, percentiles are customized based on the combination of tests you select and test weights you apply. That means that the percentile score of the overall assessment automatically adjusts to reflect changes in the importance (weights) you assign to different tests.
The best insights on HR and recruitment, delivered to your inbox.
Biweekly updates. No spam. Unsubscribe any time.
The benefits of using percentiles
Percentile scores are more robust and consistent metric to evaluate candidates, and using them comes with benefits of their own.
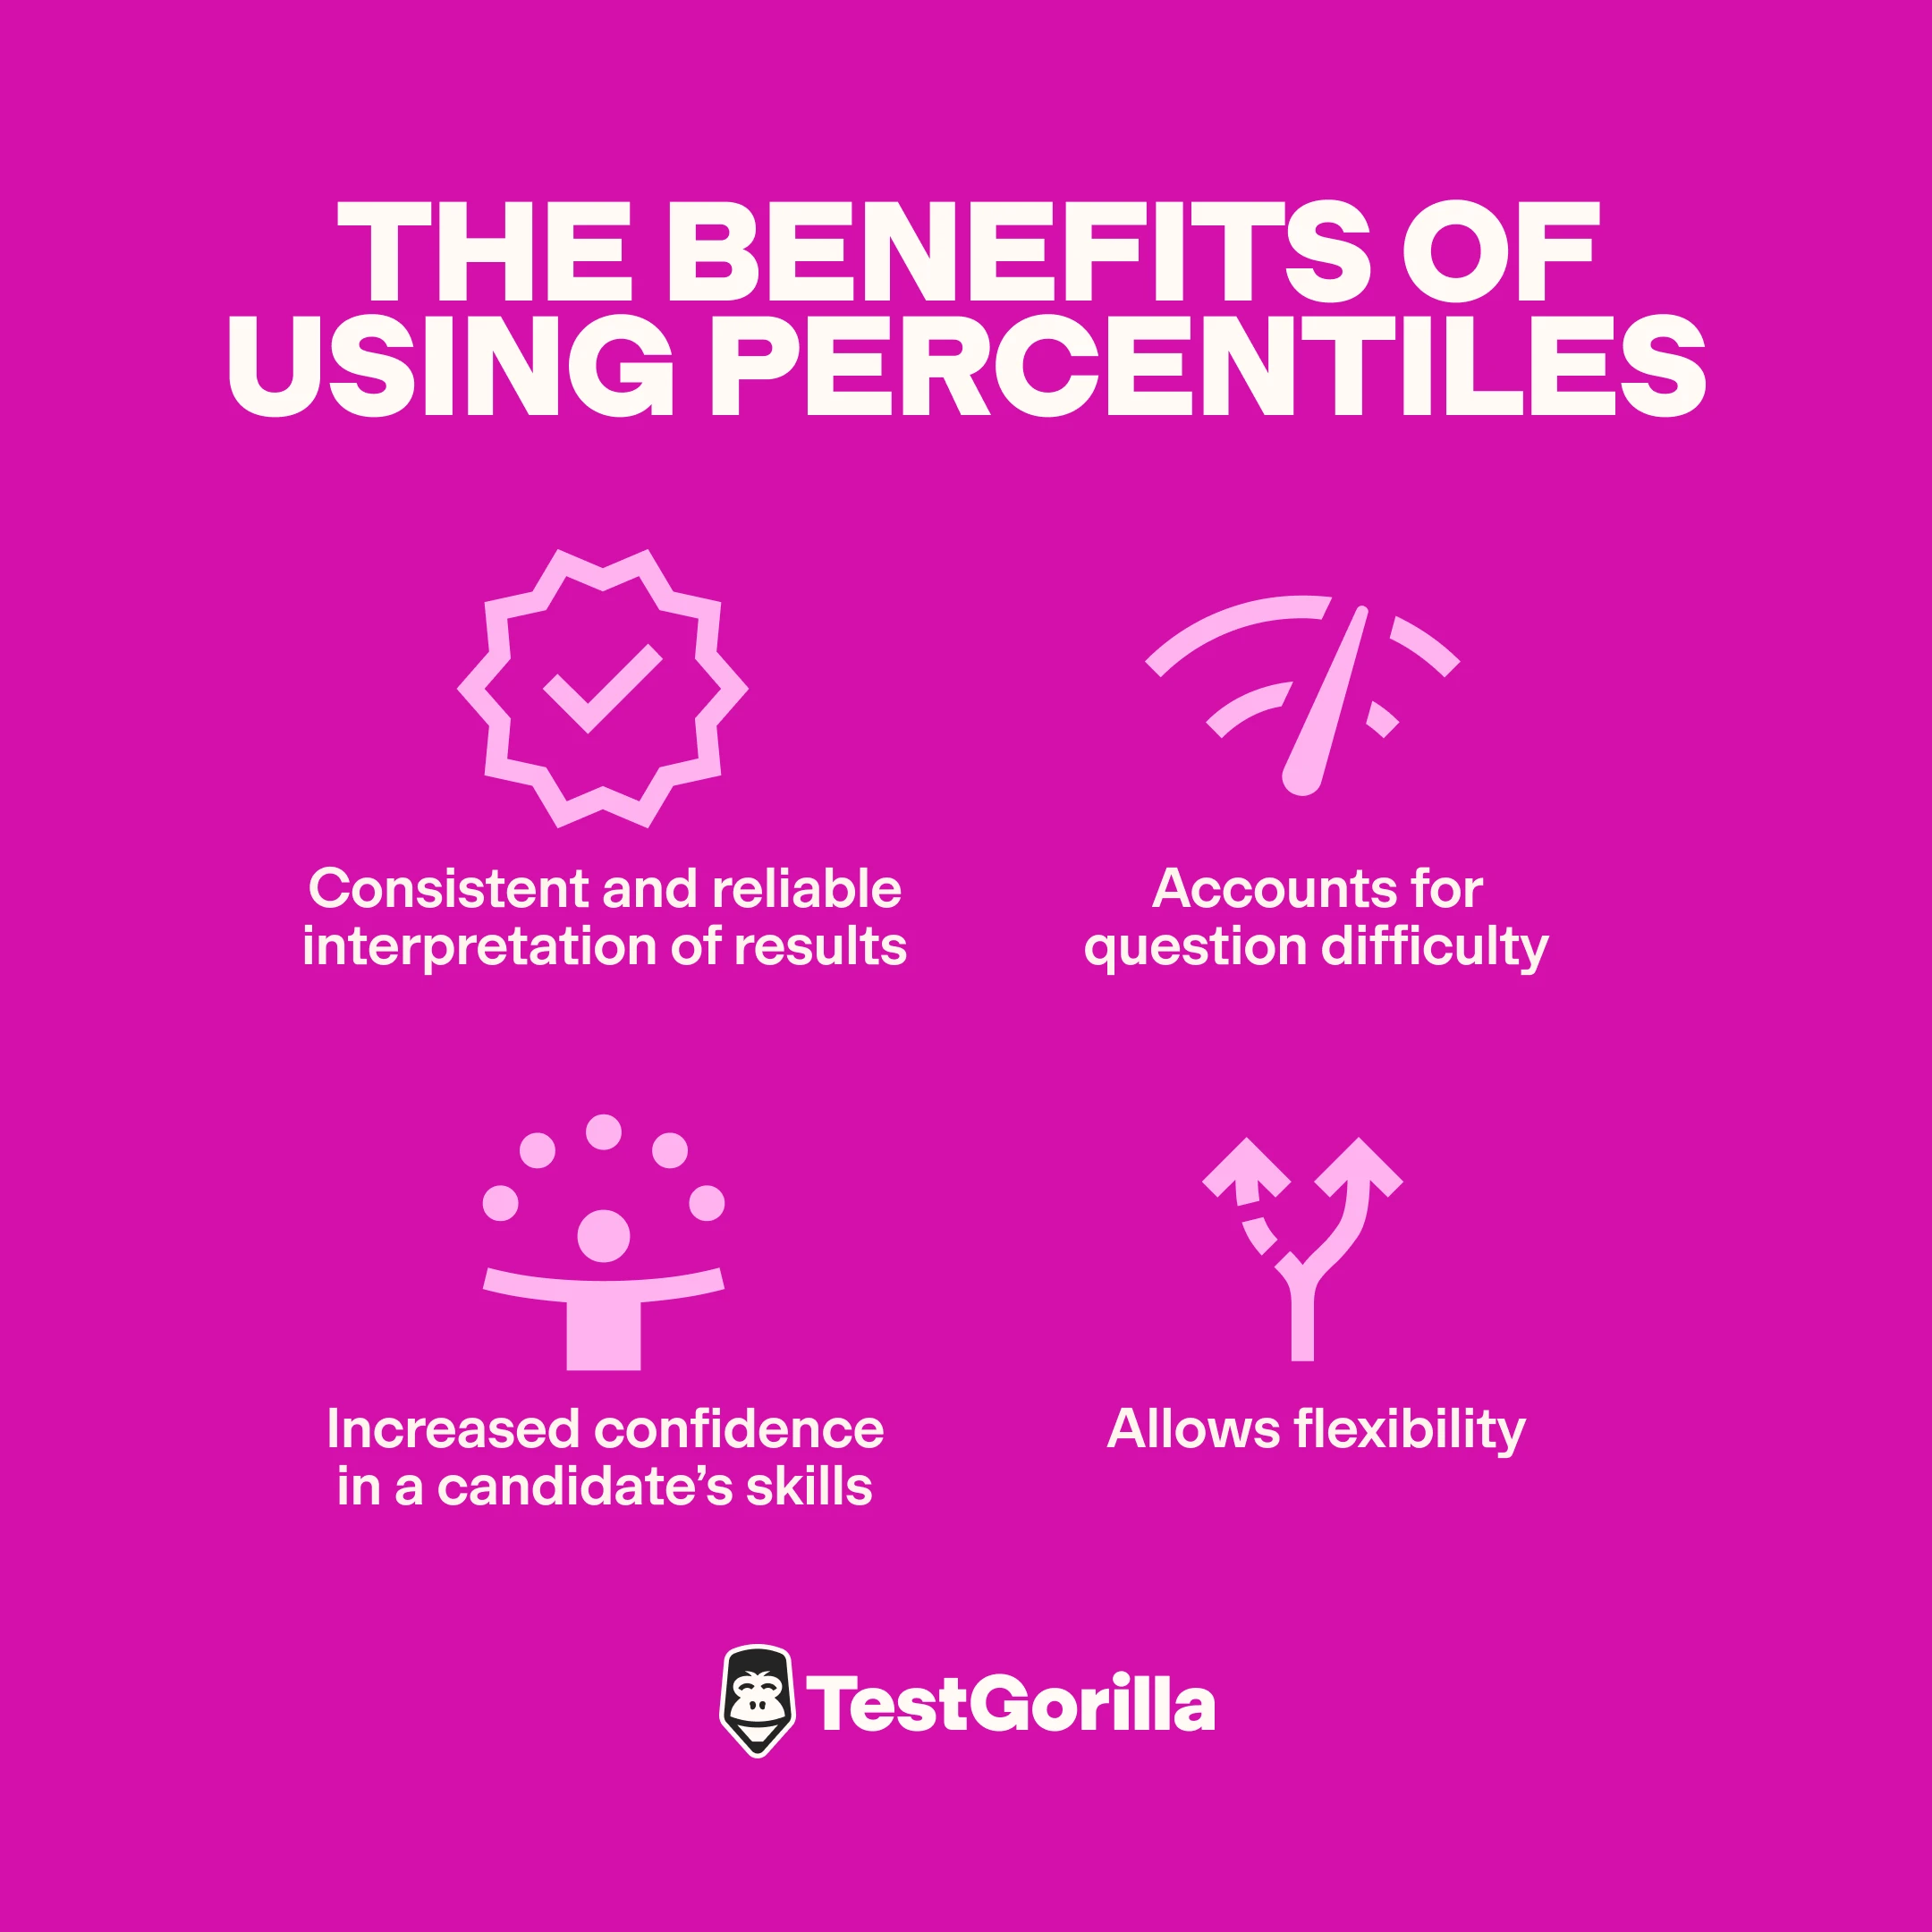
1. Consistent and reliable interpretation of results
Percentile scores provide a consistent and reliable way to interpret test results across different contexts and assessments.
In a situation where you have a rolling hiring schedule or a permanently open position, duplicating an assessment from time to time can help you protect its integrity and question security. When using percentile scores, there’s no need to ponder about differences in questions or their difficulty across assessments. A percentile score from one assessment is directly comparable to a percentile score from a different assessment, as they both reflect how a candidate compares to others.
2. Accounts for question difficulty
Using percentiles allows you to rank candidates based on their true level of displayed skills, accounting for how easy or difficult questions were. That means that your hiring process is more fair and more precise, as it removes the ‘luck’ factor from getting a certain set of questions versus a different one.
3. Increased confidence in a candidates’ skills
Percentiles offer additional insights by comparing candidates to a broader population, not just within your specific hiring pool. For instance, if you’re hiring for a competitive role like data science, knowing that a candidate is in the 95th percentile globally (rather than just in comparison to other candidates) can give you confidence in their exceptional capabilities, even when you don’t have an in-house expert to evaluate them.
4. Allows flexibility
Percentile scores can also help you approach your hiring flexibly by adjusting the overall assessment score to the specific importance you place on each test.
Suppose you’re hiring a project manager and decide to place greater emphasis on leadership skills than on hard project management skills. Even if a candidate scores slightly lower on a technical test, their overall score might still be high if they excel in leadership-related tests, aligning with your priorities.
Percentile scores unlock better hiring decisions
Percentiles aren’t just a different way to score a candidate – they’re a key to unlocking better hiring decisions. By focusing on how a candidate compares to others, percentiles help you see beyond correct and incorrect answers and make informed, confident choices.
Whether you’re evaluating individual tests or overall assessments, our approach to percentiles ensures you have the most relevant and insightful information to guide your hiring process. This way, you can identify the best fit for your team with clarity and precision.
For more content about the science behind TestGorilla’s features, all authored by our assessment scientists and IP development experts, check out:
Science series materials are brought to you by TestGorilla’s team of assessment experts: A group of IO psychology, data science, psychometricians, and IP development specialists with a deep understanding of the science behind skills-based hiring.
Related posts
You've scrolled this far
Why not try TestGorilla for free, and see what happens when you put skills first.


