Talent acquisition analytics: How to leverage your people data as an acquisition strategy and fine-tune your hiring practices
Whenever you’re recruiting, you’re taking on data. Skills test scores, cost per hire, offer acceptance rates – it’s all information that can help you make more efficient decisions.
However, if you're just letting data pile up without any analysis – or even worse, not measuring it at all – you're hiring in the dark.
Zero visibility over your hiring data risks your hiring costs increasing, your time-to-hire growing, and your candidate experience stagnating.
By using talent acquisition analytics, however, you can see where your hiring challenges lie and uncover what to focus on to attract skilled, motivated candidates.
In this article, we discuss why using data analytics is a useful talent acquisition strategy and share seven best practices to help you streamline your hiring process.
Table of contents
- What is talent acquisition analytics?
- Why are talent acquisition metrics and analytics important?
- The benefits of analytics in talent acquisition
- 7 best practices for leveraging talent acquisition analytics to acquire top talent
- 3 examples of companies succeeding with talent acquisition analytics as a talent acquisition strategy
- Use talent acquisition analytics and let data lead the way
What is talent acquisition analytics?
Talent acquisition analytics refers to the processing of employee and company data. This information helps you understand how to improve different elements of your hiring strategy.
Using talent acquisition analytics effectively, you can fine-tune how you recruit people and who you attract.
It’s not just employers who benefit from an analytical approach. Using analytics is part of a popular talent acquisition trend, where businesses are leaning into data-driven recruiting to help improve candidate experiences.
For instance, companies use data to measure how long hiring processes take and analyze why conversion rates are low. Recruiters use this data, coupled with candidate feedback, to make changes that keep hires engaged and maintain retention.
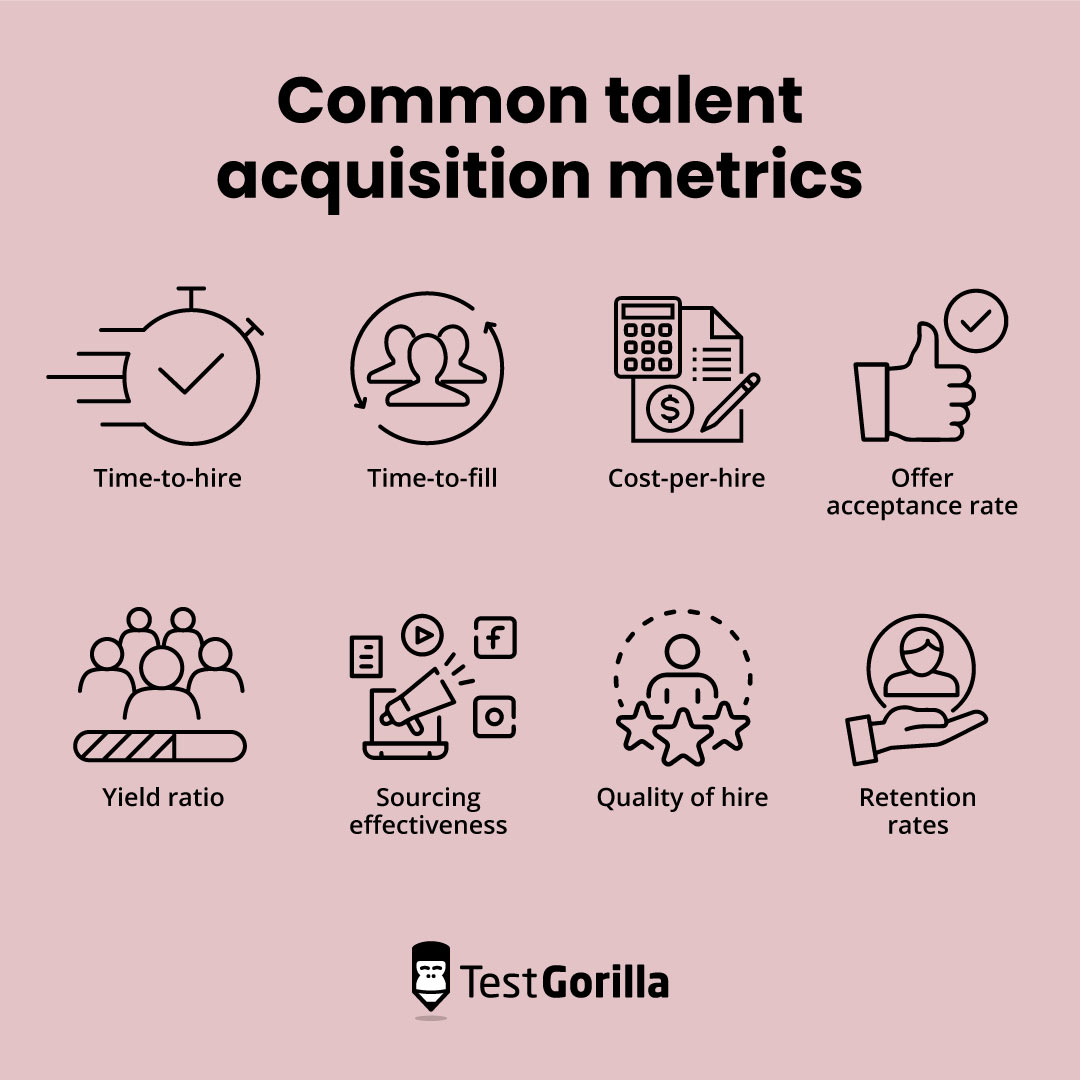
Common talent acquisition metrics
The following talent acquisition metrics are all useful in measuring the success of your hiring strategy:
Time-to-hire: The typical time it takes between a candidate entering your talent pipeline and accepting your job offer.
Time-to-fill: Similar to the above, this is the time taken between a position opening up and someone accepting your job offer across all candidates.
Cost-per-hire: How much money you spend on recruitment in a given period divided by how many hires you make. This metric factors in further costs for people you interview but don’t hire.
Offer acceptance rate: How many people accept job offers you send to successful applicants.
Yield ratio: Shows how many candidates proceed to each stage of your recruitment process. For example, out of 300 applicants, 80 make it to skills testing, 20 head to interview, and three receive job offers.
Sourcing effectiveness: How many people you hire through specific channels and sources, such as different social networks, job boards, and employee referral programs.
Quality of hire: Hire quality, although sometimes subjective, breaks down into metrics, such as job performance, attendance, and objective skills test results. It’s how productive and valuable someone is to your business.
Retention rates: The average amount of time a successful hire stays with your company. This metric ties in with others, such as sourcing effectiveness, to help break down which channels produce the longest tenures.
Types of talent acquisition analytics
There are four types of analytics to follow when breaking down your data.
Each type of people analytics asks a specific question:
Type | Question |
Predictive analytics | “What might happen in the future if we do this?” |
Prescriptive analytics | “What’s the best course of action to take next?” |
Historical or descriptive analytics | “What happened, when, and why?” |
Diagnostic analytics | “Why did this occur?” |
Using data analytics software, you can apply these questions to the data and metrics listed above and get a clear picture of your recruitment process from end to end.
For instance, you could use predictive analytics in talent acquisition to decide where to focus your recruitment marketing. If more successful candidates apply through Instagram ads, that’s where you should prioritize your budget.
Why are talent acquisition metrics and analytics important?
Talent acquisition analytics show you what's working in recruitment and what isn't.
Using data to support talent acquisition helps recruiters find out where hiring funnels are at their slowest, where marketing isn’t reaching suitable talent, and where there's a need to focus more on candidate needs.
Multiple steps along your hiring process need careful attention, such as candidate follow-up, interview planning, and information delivery.
For example, your time-to-hire and recruitment funnel planning can positively and negatively affect candidates' experiences with you.
The average time-to-hire for US businesses is around 36 days.[1] However, 62% of job candidates say they lose interest in a role if the employer takes more than two weeks to respond after the initial interview.
This jumps to 77% if they still haven’t responded after three weeks.[2]
Analytics help recruiters break down unnecessary hiring steps to keep the process quick and the applicants interested and engaged.
Moreover, measuring metrics, such as time-to-hire, helps recruiters become more communicative with potential employees. People applying for work want to know what happens at each stage and don't want to wait around.
You don’t want a poor recruitment process to give applicants a bad first impression of your company.
The benefits of analytics in talent acquisition
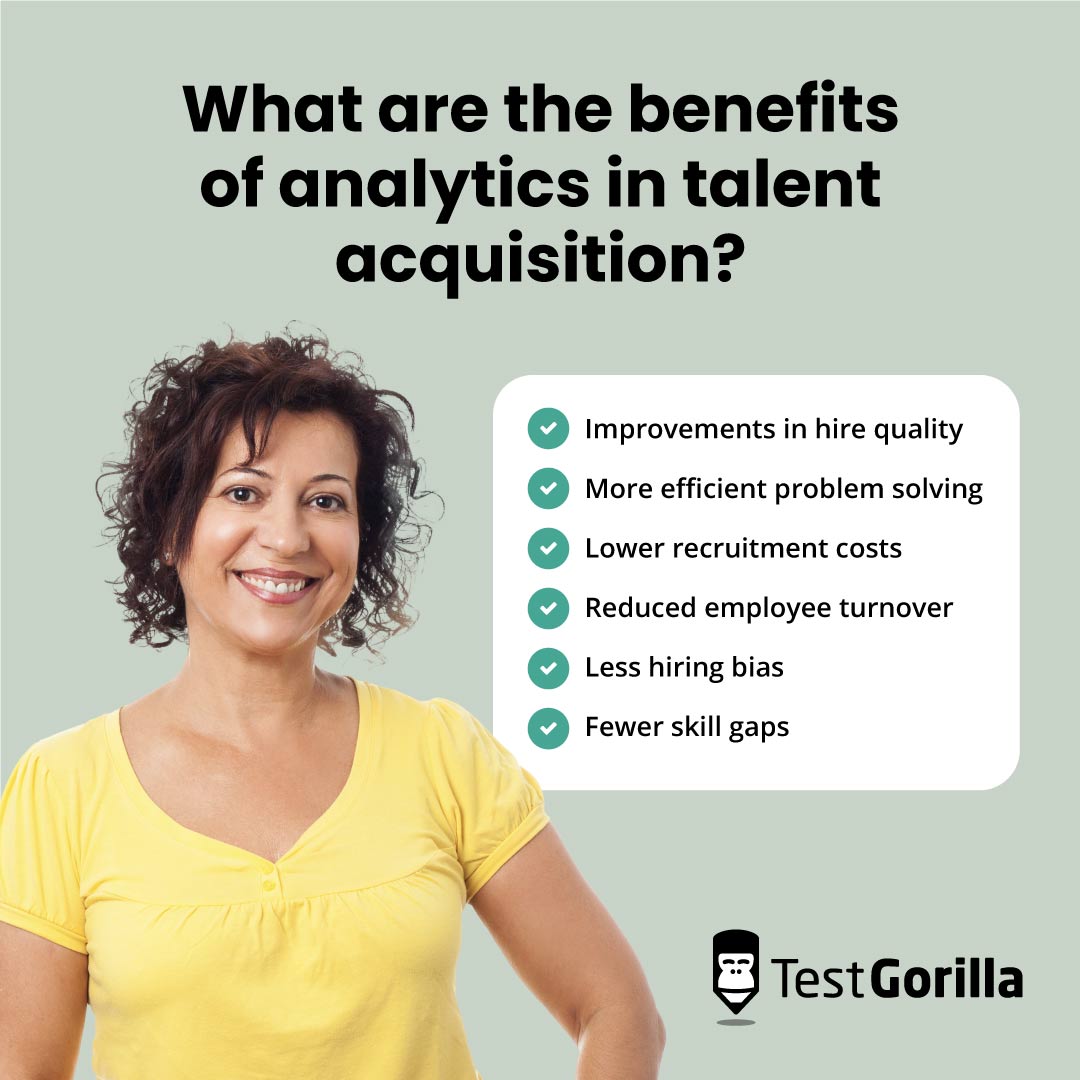
When using talent acquisition reporting and analytics to help inform your hiring processes, you can expect:
1. Improvements in hire quality
2. More efficient problem solving
3. Lower recruitment costs
4. Reduced employee turnover
5. Less hiring bias
6. Fewer skill gaps
Let's look at why and how this might be the case.
Improvements in hire quality
Finding quality hires is becoming more concerning for recruiters. Research shows HR's confidence in finding suitable candidates is dropping by 2% annually.
Analyzing talent acquisition data more efficiently helps to boost this confidence.
When you analyze the data of your most successful hires, you can build an ideal candidate profile (ICP) and mold your recruitment strategies around engaging with that prospect.
You can organize your employees by performance data, such as attendance figures, deadline adherence, and certain skills test results. Then, dive deeper into what each of these high performers share in common by using any emerging patterns to adjust your ICP.
Moreover, score data proves helpful in assessing skills gaps in your team – more on that shortly.
Efficient problem-solving
Acquisition analytics helps you lay hiring processes out completely flat, meaning it's easier to see what's working and what isn't at each stage.
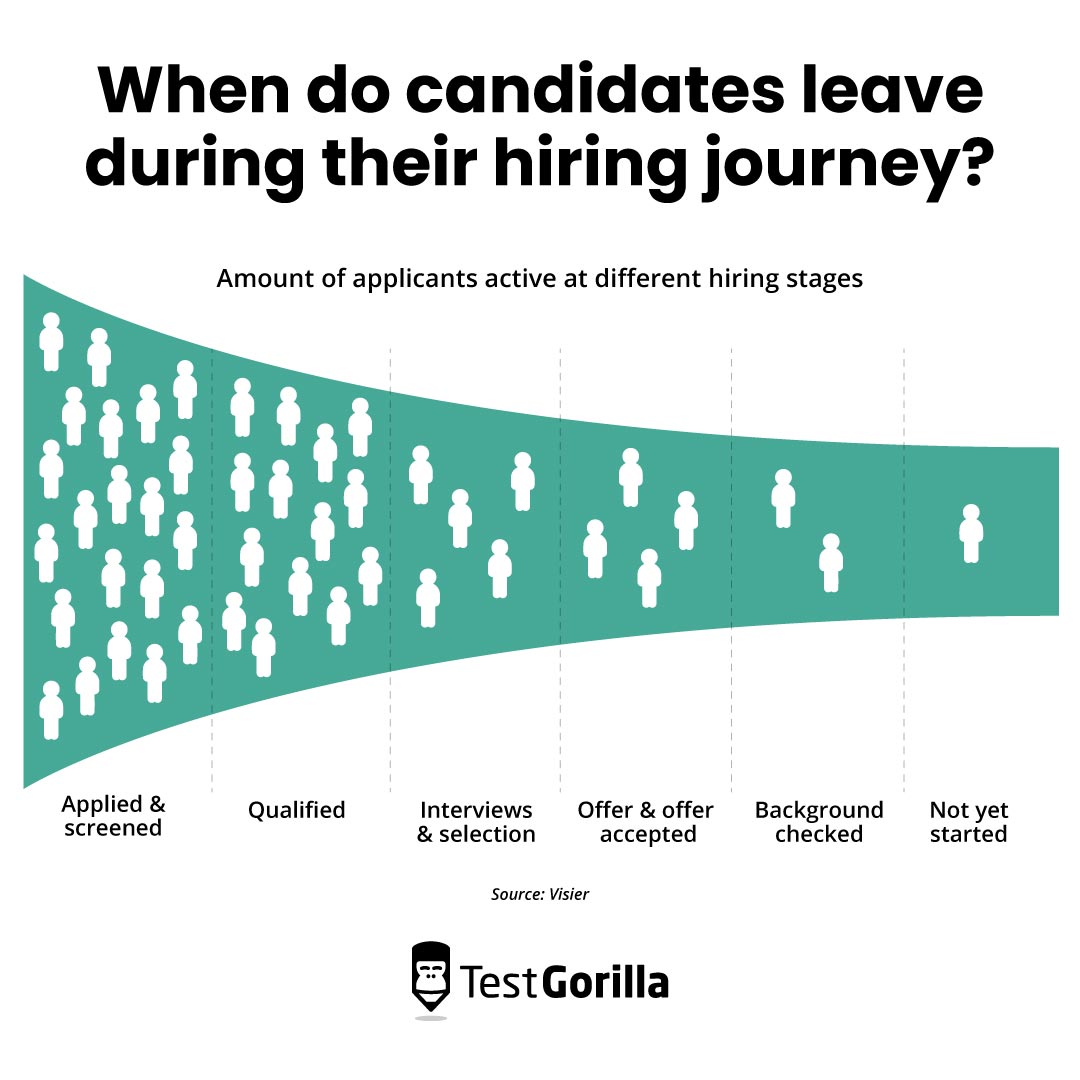
For instance, a recruiter could use analytics software to check when candidates leave their hiring funnels most frequently. Here’s an example of a hiring journey visualized as a graph:
This graph shows applicants dropping out of the hiring process shortly after qualification, around the time of interviewing.
You could use this information as a starting point for refining how you interview candidates. For instance, the process might be too slow or not align with what applicants expect from the job profile.
This potentially hidden issue doesn't always become obvious until you have visual acquisition data to work with. Consider pairing this data alongside feedback from employees to strengthen your decision-making – more on that further down.
Lower recruitment costs
Recruitment costs escalate when the people you hire don’t make the grade.
The cost of a bad hire, or an employee you fire or who quits shortly after probation, varies depending on several factors. Hiring and onboarding costs can rack up to $240,000 per employee for companies with particularly expansive candidate searches.[3]
Regardless of cost, it’s still money to lose if you’re simply going to fire a recruit soon after onboarding.
Use talent acquisition analytics to determine which recruitment campaigns are converting the best and worst hires and prioritize hiring through the best channels and techniques. You could also use this data to improve recruitment efforts that aren’t hitting the mark.
Successfully analyzing recruitment data this way means you don't have to:
Waste money on bad hires
Invest extra money in recruitment drives
Worry about losing productivity because of poor-quality talent
Reduced employee turnover
Drilling deep into turnover data helps you understand why people leave your company. Using retention and tenure data, consider asking yourself:
What’s your fire vs. resignation rate?
Are there similarities between people who choose to leave within six months?
Am I firing the same demographics time and again without realizing it?
Data analytics strategies help you understand turnover drivers and keep people onboard for longer. As an example, use employee offboarding feedback to ascertain why people leave.
Let’s take another look at the data we mentioned above and use it to determine which channels and recruitment campaigns drive the highest turnover.
If there’s a clear difference in eventual turnover between job board hires and LinkedIn hires, look into the differences between these campaigns – something as subtle as the language you use or the details you include in marketing could tip the scales.
Data shows where you can intervene to reduce employee turnover. It just then becomes a case of experimenting with the how.
For instance, provide more learning and development opportunities to potential leavers, or create a plan to extend the contracts of contingent workers who exceed your expectations.
Less hiring bias
Unconscious bias in hiring restricts you from reaching a broader talent pool and risks marginalizing people otherwise well-suited to join your team.
When you rely on data to inform how and who you recruit, you become more mindful in making your process more objective, and you’re less likely to exclude people for no reason.
Hiring data can help you produce an inclusive hiring strategy that doesn’t turn people away because of debunked qualifiers, such as education or professional experience.
Data analytics helps you judge candidates based on their skills and performance, not their experience, where they went to school, or who they already know at the company.
Data reports could tell you that your ideal graphic designer scores highly in communications tests, delivers projects ahead of their deadlines, and excels in software, such as Adobe Creative Cloud and Canva – all factors independent from diplomas or past employment.
Giving into hiring bias deprives you of the benefits of hiring more diverse candidates.
Fewer skill gaps
Skills gaps tell you where skills are missing in your workforce.
Let’s say you foresee the need to create more teams in the short term but lack management personnel. You’re unsure which of your current employees are ready for a promotion, but after performing a skills gap analysis, you discover a leadership skills gap you need to fill.
Since these leadership skills are absent among your available staff, you decide the best course of action is to hire externally to fill that gap. While not ideal, it’s a better outcome than promoting an employee who is not yet qualified for the position.
A survey of HR professionals reveals skills gaps are widening, with a leap of 14% in one year – many companies may not even know that such a gap harms their productivity.
This underlines the importance of equipping yourself with the right tools – like a talent assessment platform – to assess skill gaps before worrying about the data.
7 best practices for leveraging talent acquisition analytics to acquire top talent
Now that we’re clear on the many benefits of talent acquisition analytics, let’s focus on how you can use this technology to improve your hiring and business outcomes.
We recommend you implement all seven best practices to see the best results.
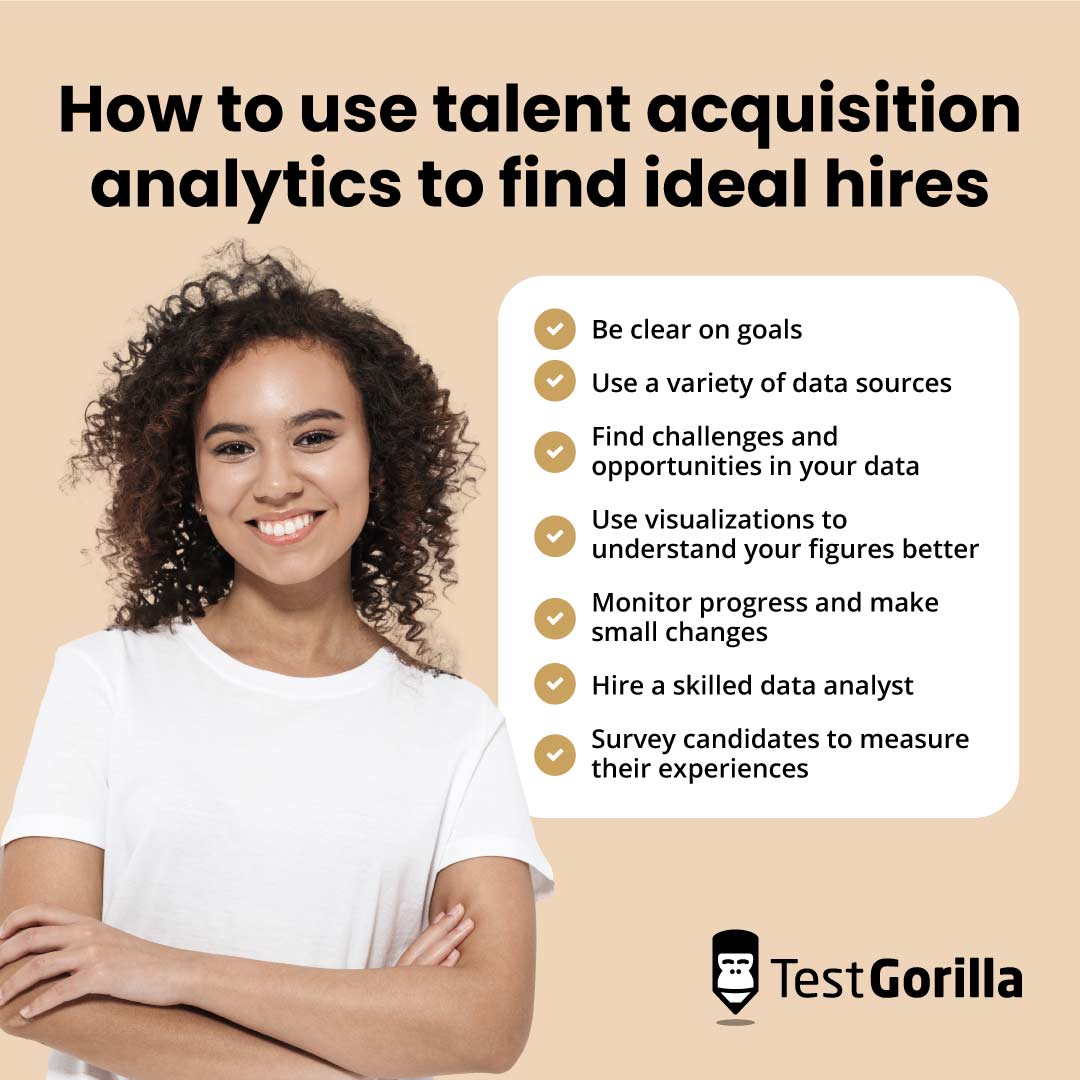
How to use talent acquisition analytics to find ideal hires
Best practice | Brief summary |
1. Be clear on goals | Set a hypothesis, check your data, and build a conclusion to help improve specific areas of your hiring process |
2. Use a variety of data sources | Take advantage of different tools to measure and report on a variety of problems and metrics in your hiring process for actionable conclusions |
3. Find challenges and opportunities in your data | Ask yourself questions about why your data might skew a specific way and think creatively about how you can change it for the better |
4. Use visualizations to understand your figures better | Create dashboards and reporting tools to make data easier to understand so you can take more efficient, confident action |
5. Monitor progress and make small changes | Don’t assume big changes fix all your problems immediately – lay out a roadmap and focus on gradually trialing changes so you can revert if they don’t work out |
6. Hire a skilled data analyst | Work with experts who translate and explore complex data for you and save time and effort breaking it down yourself |
7. Survey candidates to measure their experiences | Trust candidates and employees to provide opinions based on a numeric scale to build hiring experiences around feedback, not assumptions |
1. Be clear on goals
You need more than raw data alone to solve your problems.
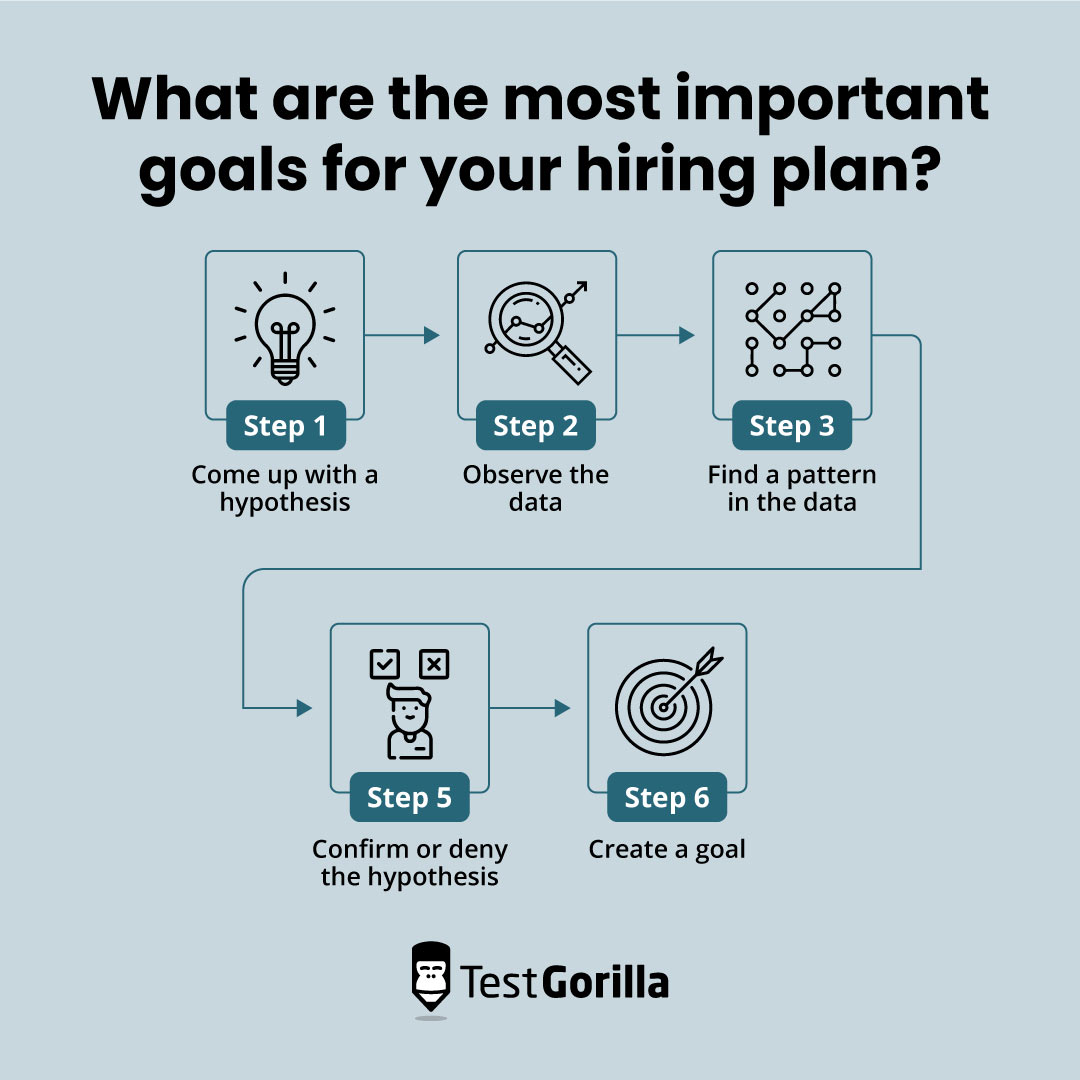
You need to set a hypothesis – pose a possibility for why something is the way it is – then test your data based on that hypothesis and create a goal based on your conclusions.
Let’s build an example using this five-step process:
Come up with a hypothesis: “Our hiring costs are too high because of poor communication.”
Observe the data: Check time-to-hire, cost-per-hire, employee turnover, and yield ratios.
Find a pattern in the data: You determine that many of the best candidates are rejecting job offers because too much time passes after their applications. This causes you to send offers to lower-ranking candidates who often turn out to be mis-hires, so you need to start the process over again.
Confirm or deny the hypothesis: You discover that the cause of the job offer delays is indeed due to a lack of communication between hiring managers.
Create a goal: “We need to improve our recruitment marketing and hiring efficiency by focusing more on communicating with our talent acquisition team.”
Consider the most important goals for your business's hiring plan here and now.
Do you want to reduce recruitment costs?
Look at metrics, such as cost per hire and time-to-hire, and track how much you spend on recruitment on average and where to trim down the process.
Consider looking at source data in this scenario. Analytics could tell you agency hires don’t stay with you for as long as job board hires, in which case, you can confidently cut back agency costs.
If you test a hypothesis and are unable to confirm it, that helps to narrow down your goals. Repeat the process until you find something that makes sense and that you can act upon.
2. Use a variety of data sources
With the right budget, you can have plenty of diverse tools at your disposal, such as applicant tracking systems, candidate relationship management software, and online skills testing.
Consider narrowing down your technology choices based on your analytics goals.
Do you want to improve candidate experience to attract better applicants?
Choose a candidate relationship manager and track each step of your candidates' journeys.
Look at time-to-hire data and see if there are any clear drop-offs around a specific point in the process.
Use recruiting automation to capture live data on where people find your job postings and track response times between each time you communicate with them.
Use talent assessments to complete a skills gap analysis across your workforce and prioritize testing applicants on the talent you need that’s missing.
For an effective data-driven approach, it’s important to understand which analytics tools are appropriate for diagnosing which problems.
3. Find challenges and opportunities in your data
When you've sourced the data you need, look for gaps and correlations and get creative about how you fix them.
Do you find your turnover rate higher among a certain demographic, such as working parents?
Consider tailoring specific compensation and benefits to their needs and prioritizing flexibility in the workplace to help them better combine their personal and working lives.
Is your candidate quality for a specific role consistently low?
Test your best employees in that department and prioritize testing new hires based on the highest correlating scores. As discussed earlier, the four types of analytics help you ask questions about your data.
Be prepared for the answer to challenge you, and be willing to adjust your processes if you want to bring about positive change.
4. Use visualizations to understand your figures better
Not everyone enjoys looking at rows and rows of data. Thankfully, analytics software can help you visualize real-time information in graphs, charts, and diagrams that are easier to digest.
Recruitment dashboards layout information visually to see clear opportunities for improvement.
Let's say you use software to organize employment channels by the average tenure of the employees that came from them. Your software could produce a simple pie chart where it's clear most people quit having onboarded through a social media channel like LinkedIn.
5. Monitor progress and make small changes
You’re unlikely to make sweeping changes to your recruitment success overnight, especially if your focus is on a long-term goal, such as reducing turnover.
Therefore, monitoring your data analytics closely and making small, incremental changes is good practice.
This way, you gradually test each change you make to see if there are any positive correlations. Use software like a recruiter dashboard to pull in information about time-to-hire and monitor it daily when you start streamlining your process.
Making small changes helps you bounce back and adjust easily if you make an error or if strategies don’t work out.
6. Hire a skilled data analyst
Data analysis is fascinating but complex, which is why many HR managers in larger companies work closely with expert analysts.
These specialists help break down what all your hiring data means in practice. It’s time and effort saved, and you reduce the chance of making costly mistakes.
If you run a large operation and have the budget, consider following this route. Like any role, put skills testing to good use to ensure you find a professional you have confidence in.
Try recruiting for the role using TestGorilla’s Working With Data test, which explores a candidate’s ability to analyze and interpret data and use graphs and charts.
7. Survey candidates to measure their experiences
It’s not always easy to measure candidate experiences unless you have specific feedback from those directly involved.
Think about designing a survey for applicants to fill out at the end of the recruitment process to gauge their opinions.
You could use number scale questions, asking people to grade their experiences from one to five on specific statements:
“The company responded quickly to my queries”
"My interviewer made me feel welcome"
“The hiring process was needlessly complicated”
By capturing numeric data from these statements, you can organize this data to see where improvements are required.
Consider introducing these questionnaires when you welcome employees as part of onboarding best practices and at regular performance reviews a few months down the line.
It’s even worth asking long-term employees to take part because their opinions give you insight into what drives tenure.
3 examples of companies succeeding with talent acquisition analytics as a talent acquisition strategy
Many companies use data analytics to improve hiring standards – but here are three we think you should take particular inspiration from.
Talent acquisition analytics examples from successful brands
Company | How it uses analytics |
Unity Technologies | Regularly measures and adjusts simple recruitment stages with machine learning to streamline hiring efficiency |
Juniper Networks | Measures employee entry and exit points to track their career journeys – and uses this data to adjust processes, boosting retention and extending tenure |
Microsoft | Prioritizes data from employees it believes most likely to have short tenure to inform changes in candidate experience and reduce turnover |
Unity Technologies
Unity, a games development studio, uses a thorough yet simple approach to analytics in talent acquisition.
The company uses a simplified recruitment funnel to outline each stage of its hiring process and adjust how long it takes with the help of machine learning.
The firm sets clear parameters for its funnel to ensure its eight stages receive highly specific data. This strategy helps the company streamline the same stages for each position it hires for, keeping information consistent and easy to work with.
By clearly setting benchmarks for interview conversion rates, the studio ensures it continuously adjusts its funnel so it’s optimized for finding the best candidates.[4]
Juniper Networks
Juniper, a networking cybersecurity firm, takes a similar approach to Unity and is always ready to make adjustments to its hiring process.
Specifically, the company goes beyond the basic expectation of measuring where employees come from by modeling where they’re heading.
By using data to create accurate predictions of where its best candidates are headed in the long run, the firm understands how to best recruit and retain them.
This strategy helps the business maintain a more progressive hiring process as the job market changes, always ready to adjust in line with evolving employee needs.
Microsoft
Microsoft, the computing giant, uses data to drive much of its HR practice.
In particular, it relies on data to help profile candidates and create a more desirable workplace for new hires.
The company looks carefully at the employees most likely to leave its workforce in the short term and molds its workplace strategies around them.
It focuses on high-turnover areas and builds strong candidate experiences based on open communication and development opportunities.
Diving into data this way has ensured the brand halved its turnover rates in several areas, applying the same techniques elsewhere in its business.[5]
Use talent acquisition analytics and let data lead the way
Without talent acquisition analytics and data visibility, you risk bad hires.
Even if you already have the raw data in front of you, it’s important to know how to analyze it and make informed recruitment decisions.
Using analytics as a talent acquisition strategy, you can:
Encourage high-quality talent into your firm
Reduce your cost per hire
Improve your candidates’ experience
Keep hold of top talent for longer
Before diving into data for the first time, read our guide on talent acquisition technology to support you – and be sure to use data as part of your strategic workforce planning, too.
And finally, don’t forget to head to our talent assessment library and start sourcing powerful skills-based data from your employees.
Sources
“SHRM Customized Talent Acquisition Benchmarking Report”. (2017). Society for Human Resource Management. Retrieved September 21, 2023. https://www.shrm.org/ResourcesAndTools/business-solutions/Documents/Talent-Acquisition-Report-All-Industries-All-FTEs.pdf
Half, Robert. (February 10, 2021). “How To Lose A Candidate In 10 (Business) Days”. PR Newswire. Retrieved September 20, 2023. https://www.prnewswire.com/news-releases/how-to-lose-a-candidate-in-10-business-days-301225756.html
Sundberg, Jörgen. “What Is the True Cost of Hiring a Bad Employee?”. Undercover Recruiter. Retrieved September 21, 2023. https://theundercoverrecruiter.com/infographic-what-cost-hiring-wrong-employee/
Evans, Anne. (May 30, 2018). “How We Use Data and Analytics to Make the Best Hiring Decisions”. ERE. Retrieved September 21, 2023. https://www.ere.net/articles/how-we-use-data-and-analytics-to-make-the-best-hiring-decisions
McNeill, Megan. (May 17, 2020). “How 5 Successful Companies Are Using HR Analytics”. ICS Learn. Retrieved September 21, 2023. https://www.icslearn.co.uk/blog/human-resources/how-5-successful-companies-are-using-hr-analytics/
Related posts
Hire the best candidates with TestGorilla
Create pre-employment assessments in minutes to screen candidates, save time, and hire the best talent.
Latest posts
The best advice in pre-employment testing, in your inbox.
No spam. Unsubscribe at any time.

Hire the best. No bias. No stress.
Our screening tests identify the best candidates and make your hiring decisions faster, easier, and bias-free.
Free resources
This checklist covers key features you should look for when choosing a skills testing platform
This resource will help you develop an onboarding checklist for new hires.
How to assess your candidates' attention to detail.
Learn how to get human resources certified through HRCI or SHRM.
Learn how you can improve the level of talent at your company.
Learn how CapitalT reduced hiring bias with online skills assessments.
Learn how to make the resume process more efficient and more effective.
Improve your hiring strategy with these 7 critical recruitment metrics.
Learn how Sukhi decreased time spent reviewing resumes by 83%!
Hire more efficiently with these hacks that 99% of recruiters aren't using.
Make a business case for diversity and inclusion initiatives with this data.

