HR dashboards: A guide for data-driven HR professionals
Collecting data is one of the most powerful things you can do as an HR professional.
A lot goes on in your workforce, and without data visibility, you don’t know the impact it’s making. How are your diversity metrics progressing? Is your top account executive ready for development?
Answering these questions helps you make informed, strategic decisions that power your company, but you can’t answer them accurately without capturing and analyzing data.
Enter the HR dashboard, a piece of software that offers a quick and easy way to monitor a wealth of data, including demographics, compensation, performance, and development.
This HR technology gives insight into your processes, enabling you to retain high performers, hire the right people, and increase efficiency.
This article dives into the importance of HR metrics dashboards and how to get the most out of them. It also lists our top software recommendations so you can get started immediately.
Table of contents
What is an HR dashboard?
An HR dashboard is software that enables organizations and HR professionals to capture, analyze, and report on different HR metrics. You can visualize these metrics through a comprehensive dashboard where HR teams can get a detailed overview of their workforce.
This HR analytics software draws data from multiple sources and displays it in one interactive dashboard, making it easy to explore in depth or review at a glance.
Human resources dashboards provide teams with an effective way to optimize their processes and improve employee performance.
This software is a key component in current HR technology trends, integrating with other tools to help you monitor factors essential to a modern workforce, like employee wellness and development.
The most common HR KPIs on an HR metrics dashboard
Let’s quickly look at the top key performance indicators HR dashboard software can measure. We sorted them into the three main areas of HR they pertain to.
Workforce management metrics | Recruitment metrics | Compensation metrics |
- Promotion rate - Time to productivity - Absenteeism rate - Internal mobility - Employee satisfaction rates - Training costs and ROI - HR effectiveness | - Quality of hire - Turnover rate - Retention rate - Resignation and retirement rate - Vacancy rate - Time-to-fill - External hire rate - Internal hire rate - Diversity ratio | - HR cost per employee - Human capital ROI - Profit vs. compensation - Labor cost - HR operating expense rate - Revenue per employee |
This data is essential to optimize processes, increase efficiency, and reduce costs. For example, you can use recruitment metrics for talent acquisition analytics to improve how you hire employees and who you attract.
Human resources dashboard examples
Here are our top HR dashboard examples for measuring talent analytics, such as an employee performance dashboard and a development dashboard.
Remember that these aren’t set in stone and are merely popular examples. With the right tools, you can create customized dashboards with pivotal metrics for your organization.
1. Executive HR dashboard
An executive HR dashboard gives you a high-level overview of all critical metrics. Generally, these dashboards display essential KPIs like recruitment costs, employee demographics, employees by role, and employee satisfaction.
2. Employee performance dashboard
These dashboards help HR teams monitor your employees’ effectiveness and progress toward their goals. They help HR managers measure satisfaction, compensation vs. performance, and engagement.
3. Employee development dashboard
An employee development dashboard helps you monitor training and development, such as how many employees undertake programs, completion rate, hours taken, and total cost.
4. Workforce demographics dashboard
It’s crucial to encourage and maintain a diverse workforce with this diversity dashboard. These dashboards give you essential visibility. They enable you to view and analyze your workforce based on age, gender, ethnicity, race, location, income, and sexual orientation.
5. Gender salary comparison dashboard
This dashboard helps HR teams ensure gender parity in compensation. It enables you to compare how different genders, such as men, women, and non-binary people, are compensated.
These dashboards pull information from your compensation management software and usually measure salary compared by gender and broken down by location, tenure, and position.
6. Team role dashboard
A team role dashboard helps HR executives get insights about large teams at a glance, including metrics for entire teams or individual roles. They help you manage team goals, group performance, satisfaction rates, and overall training.
The benefits of HR dashboards
With real-time visibility into your workforce, you can make informed decisions, guide employees with small corrections, and mitigate larger workplace risks.
Even if you regularly monitor and manage data in your organization, an HR metrics dashboard enables you to take your processes to the next level and improve productivity.
1. Help you monitor your workforce and make quick changes
An HR analytics dashboard enables you to continuously manage your people data and make prompt changes like monitoring and managing performance.
It enables you to lend a hand to struggling employees and reward high-performers.
More than 85% of professionals would switch jobs if offered more opportunities for professional development. Monitoring performance and satisfaction, then rewarding top performers promptly, directly impacts retention.
For example, you could pair promising employees with senior workers via mentoring software to provide them with new challenges and learning opportunities.
2. Mitigate risks
The ability to easily view metrics as they progress is essential for catching subtle trends. Some data may only become evident with time, especially discrimination and harassment issues.
For example, many women begin their careers closer to wage parity with men, but the pay gap gets wider over time as they progress through their careers owing to many factors, including but not limited to parenthood.
Without real-time visibility, it’s unfortunately easy for this data to go unnoticed because it’s so gradual.
Seeing these trends is especially helpful when managing a remote workforce because a lot goes unseen anyway, but discrimination is a dangerous factor to ignore.
For instance, remote work is more common for women, which may harm their overall recognition and rewards due to in-office bias.
You need data-driven remote working technology to establish equity for every employee.
3. Improve decision-making
HR dashboards enable you to have data at your fingertips, empowering you to make informed, high-quality decisions.
For example, talent assessments improve the quality of hire by giving recruiters insights into candidates’ skills through detailed data.
These recruiting platforms offer essential data to inform hiring decisions: 91.9% of employers believe skills tests are more effective than resumes for identifying talented candidates.
90% of organizations using skills-based methods saw a reduction in mis-hires, with 20% reducing mis-hires by more than half.
Data-driven recruiting is simply one of the HR functions that’s improved through an HR dashboard. Using data to inform your compensation, development, and performance enables you to build a strong people strategy.
4. Boost productivity and efficiency
Even if you’re already harnessing data in your company, an HR metrics dashboard makes the process quick and efficient.
These tools help HR leaders gather data, analyze it, and generate reports easily, boosting productivity and saving time.
Unfortunately, 36% of HR professionals don’t have the proper tools, including automation, to do their jobs efficiently.
Automation is a significant component of how an HR analytics dashboard increases your productivity. Dashboards often integrate with and automatically pull data from analytics and recruitment tools, such as applicant tracking systems.
5 best HR dashboard software
A human resources dashboard is one of the most impactful tools, but that’s only when you have one that suits your ideal HR tech stack.
Our list of recommendations provides an overview of the best tools, including their top features, pricing, and pros and cons.
Factors we considered
Here’s a quick summary of our criteria when we chose these tools:
Data visualization: The ability to easily review your data through graphs and charts gives you understandable context for each metric
Automated HR reporting: This feature enables you to easily share data with stakeholders and generate reports with higher accuracy
Mobile responsiveness: HR professionals should be able to access data, stay connected, and make decisions wherever they are
All data sources: Solid HR dashboard software should pull data from all sources, including payroll, development, performance, compliance, and recruiting
Real-time updates: HR metrics dashboards must update in real-time as new data comes in
The top HR dashboard software: A summary
Software | Description |
1. Tableau | - A large variety of charts and data visualization features - Quick sharing between team members - AI-powered insights |
2. Jira | - Highly customizable - Excellent for Agile teams - Simple interface |
3. Asana | - Facilitates collaboration with numerous stakeholders - Easy sharing and commenting - Human resources dashboard templates to help you get started |
4. Domo | - Automated reporting - AI-driven dashboard creating and evaluating - Easy manual dashboard creation |
5. HiBob | - Easy to use - Simple interface - Employee-centric software to check the health of your workforce |
1. Tableau: Best data visualization
Tableau is HR dashboard software with top-tier data visualization features.
This software has many ways to visualize your HR data, including bar charts, pie charts, histograms, Gantt charts, bullet charts, motion charts, treemaps, and boxplots.
It displays data in a way that works for you and with the specific metrics you’re measuring.
To get the most out of this complex, robust platform, we recommend you have a team member or two with honed Tableau skills.
Pros | Cons |
- Supports numerous sources of data - Useful tooltips for quick review - Easy sharing between team members - AI-powered insights | - Steep learning curve owing to an abundance of features - Less affordable |
Rating: 4.4 out of five (G2)
Pricing at time of writing: Starts at $15 per person per month
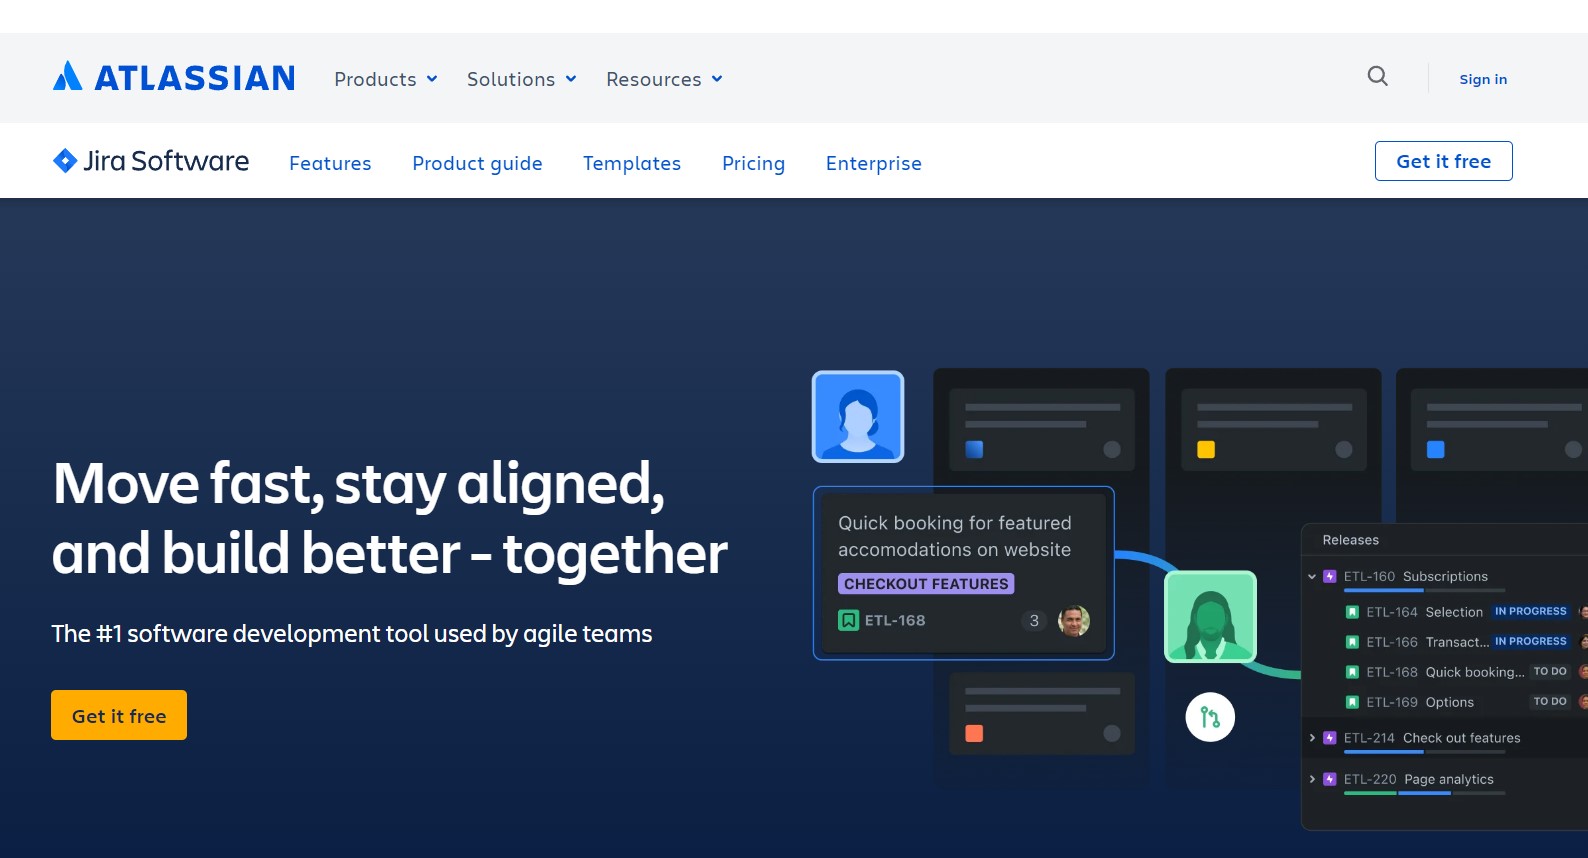
2. Jira: Best for customization
Jira from Atlassian is a powerful HR dashboard with high levels of customization.
This business intelligence tool offers deep personalization, enabling you to build a custom slideshow of dashboards, change the layout of your dashboards and high-priority dashboards, and rename and share them.
Jira also has the option to add customized gadgets to your dashboard, such as an activity stream gadget, which displays a summary of recent activity.
Pros | Cons |
- Highly customizable - Designed for Agile teams - Simple interface and shallow learning curve | - Not enough pricing options for companies with tighter budgets - Not suitable for all teams |
Rating: 4.3 out of five (G2)
Pricing at time of writing: Starts at $10 per month for 10 users
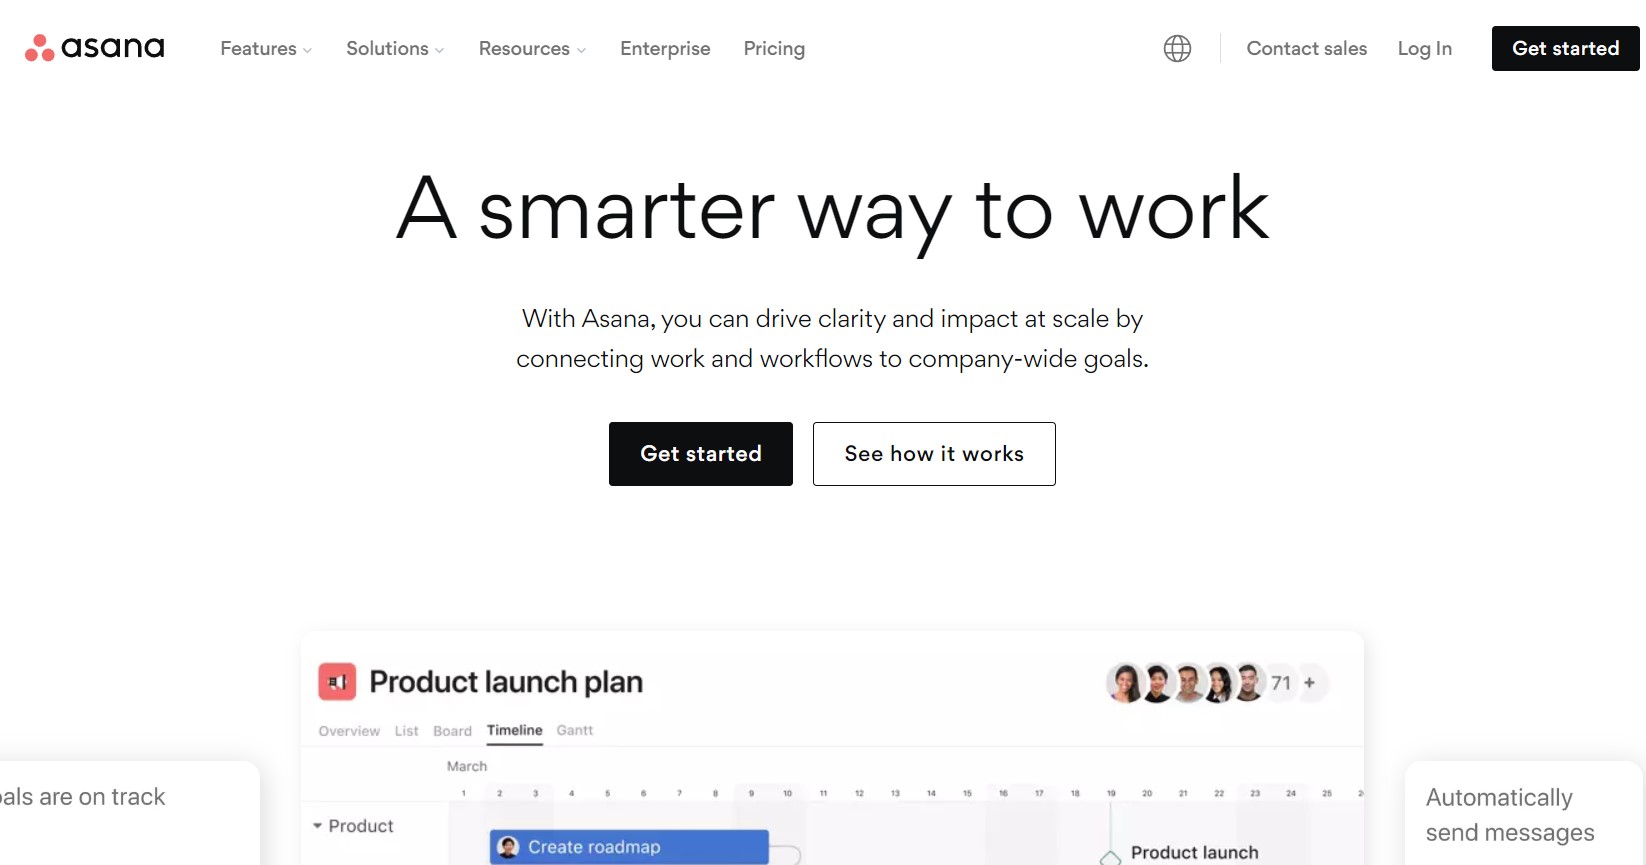
3. Asana: Best for collaboration and sharing
Asana gets all stakeholders on the same page with its strong collaboration features.
Managing multiple functions and dashboards with many stakeholders is simple with this software. It enables all parties to leave comments, enter discussions, and edit dashboards.
These features facilitate real-time collaboration and knowledge sharing, especially with high volume hiring and large-scale development initiatives.
Pros | Cons |
- Shareable data and insights - Easy-to-use functionality - Simple to jump in with little reporting knowledge | - Not enough features - Difficult to flow from one conversation to another |
Rating: 4.3 out of five (G2)
Pricing at time of writing: Free version, then starts at $10.99 for 500 seats per month
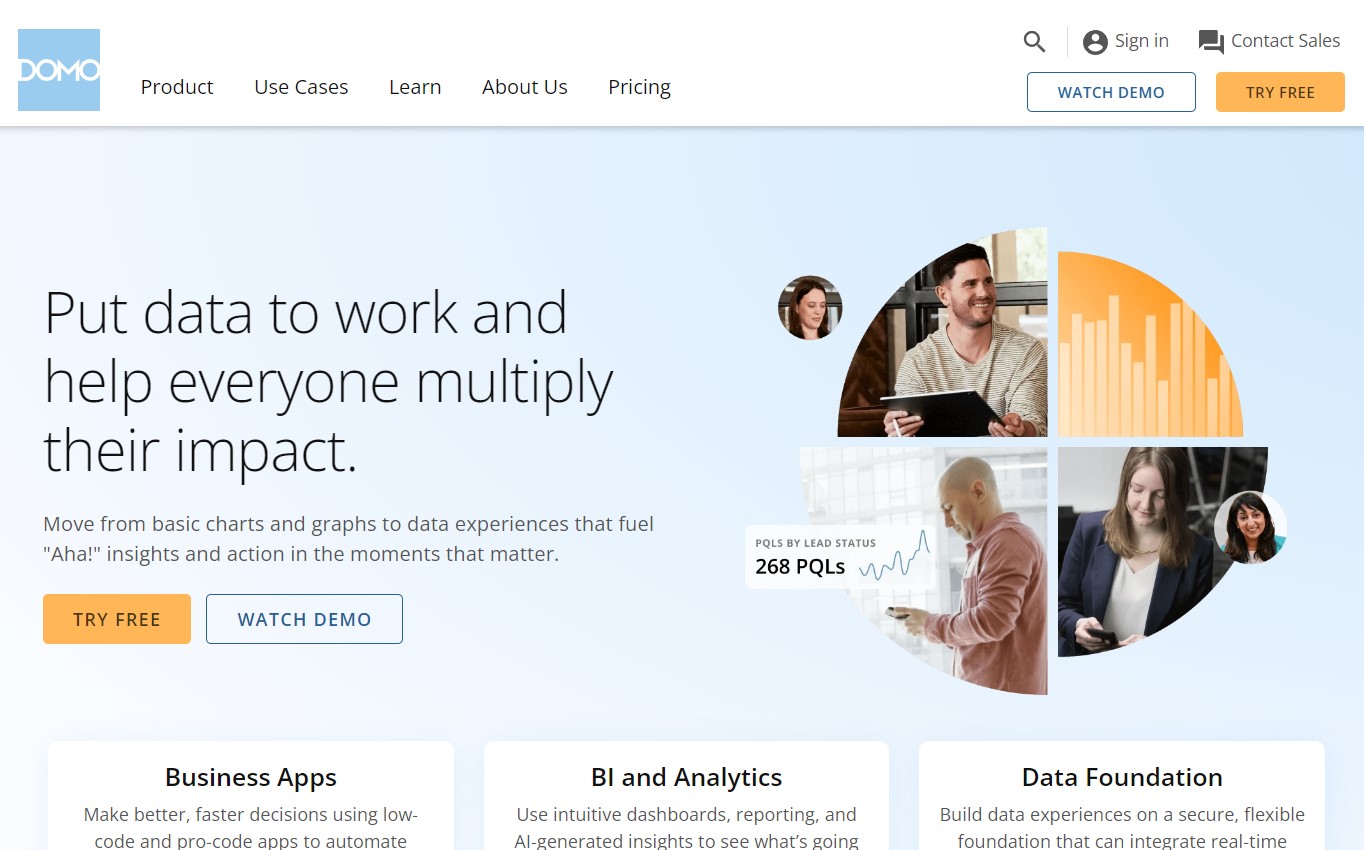
4. Domo: Best for automation
Domo enhances your productivity and speeds up your work with streamlined automation.
This software uses AI, machine learning, and automation to improve efficiency and decision-making. It uses natural language processing and predictive analytics to speed dashboard creation.
Machine learning in HR is rapidly gaining traction, helping teams make accurate predictions and better decisions.
Domo also speeds up the process of creating dashboards manually by putting crucial information at your fingertips.
Pros | Cons |
- Smooth automation - AI functionality - All-in-one data capturing, analysis, and reporting | - Less affordable - Occasionally, lackluster customer support |
Rating: 4.4 out of five (G2)
Pricing at time of writing: Free version, pricing available upon request
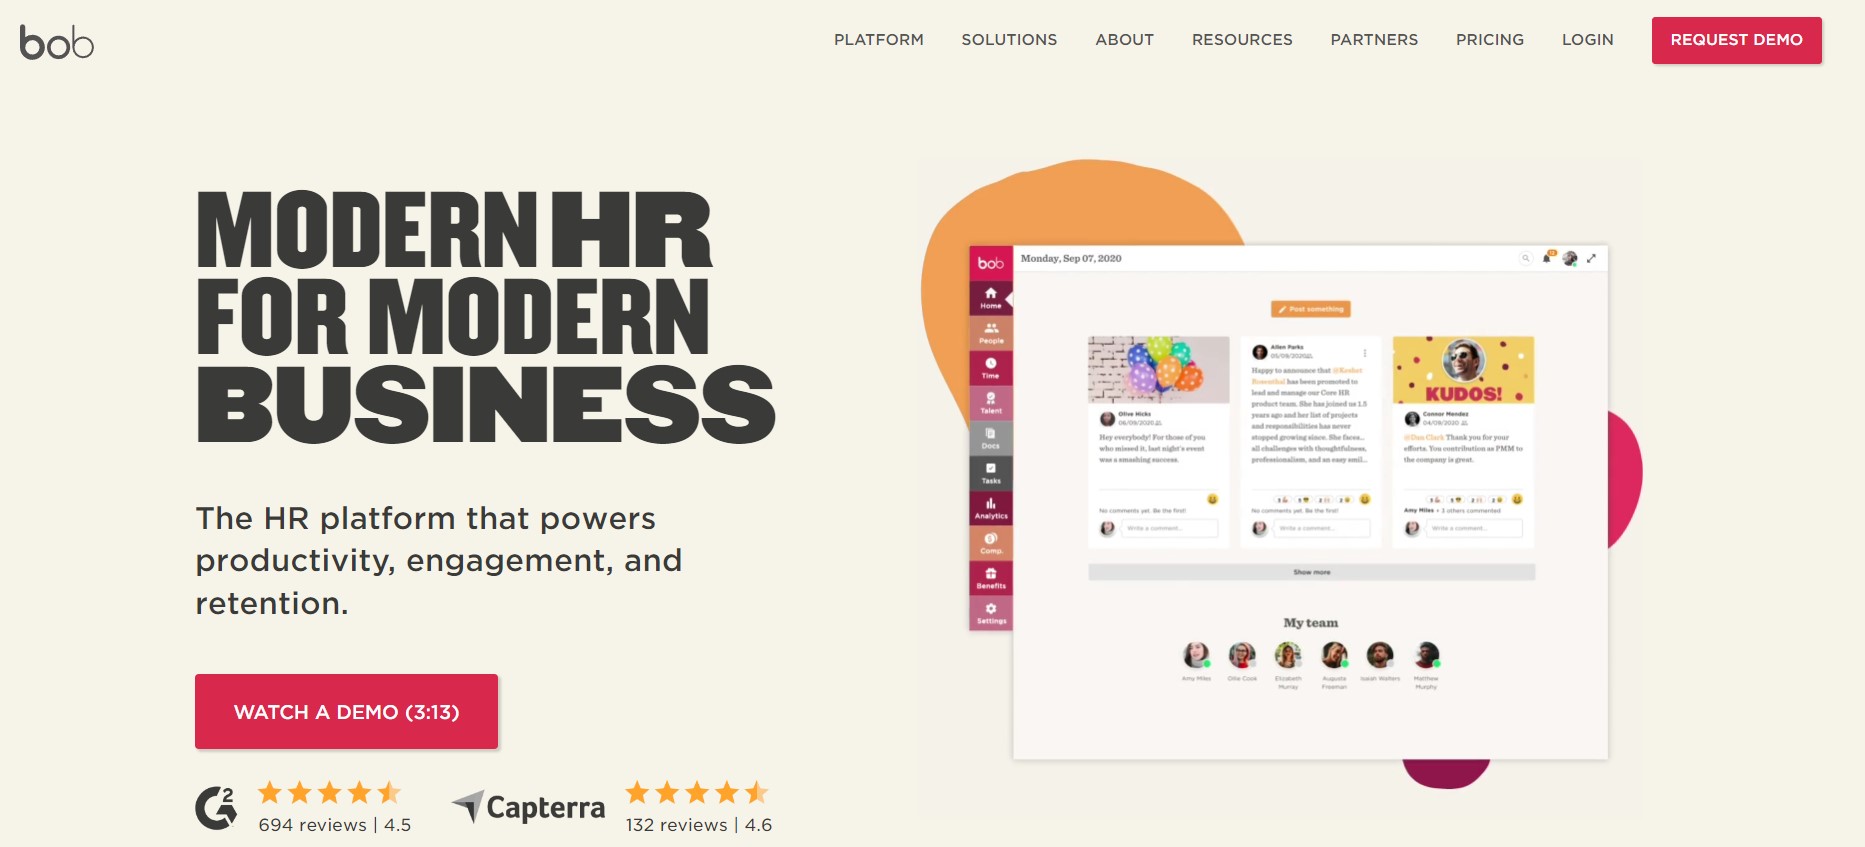
5. HiBob: Best for ease of use
HiBob is an HR platform that boasts a simple interface and easy-to-use features.
This tool has a straightforward, easy-to-navigate interface. It’s intuitive to learn with a shallow learning curve – most users claim you don’t need to learn how to use it; it just comes naturally.
It’s also an employee-centric platform, making it simple to generate reports about the health and wellbeing of your people.
Pros | Cons |
- User-friendly interface - Great third-party integrations - Easy data sharing with multiple departments | - The mobile app lacks important features like document access - Separate pricing for surveys and performance management |
Rating: 4.5 out of five (G2)
Pricing at time of writing: Available upon request
4 best practices for leveraging HR analytics dashboards in your HR department
Ready to get started and adopt HR dashboard software?
While you deliberate your software decision, let’s check out a few best practices so you can get the most out of whichever tool you pick.
Strategies for human resources dashboards: A summary
Strategy | What it accomplishes |
1. Regularly update data sources and integrations | Ensures you’re working with the most relevant data and reduces the number of tools and dashboards you work with |
2. Make dashboard management a part of your regular schedule | Increases your analytics skills and normalizes the practice so it's second nature |
3. Use analytics to improve your processes | Prompt action improves processes, and correlating multiple data sources uncovers detailed information |
4. Leverage automated reports to increase efficiency | Increases productivity and visibility, letting you spend your efforts on your employees |
1. Regularly update data sources and integrations
You can make your HR dashboard work more efficiently and productively by updating your data sources and integrations.
Streamline your data collection by integrating as many tools as possible to reduce the number of dashboards and logins you need to monitor.
It’s best to manage all your analytics from one piece of software. For example, you can integrate some HR dashboards with Google Analytics to view this data from your HR tech instead of logging into Google Analytics each time.
Ensure you also take the time to maintain your data sources. Keep them up-to-date as the most recent, relevant, and frequently used sources.
Old tools connected to your dashboard aren’t helping, and brand-new tools collecting valuable data don’t help if you don’t hook them up to your dashboard.
Some team members may only check your HR dashboard without logging into each separate account.
2. Make dashboard management a part of your regular schedule
You can make dashboard management second nature by working it into your normal schedule.
It’s daunting to see so many HR dashboards humming with real-time data, but it becomes less intimidating when you make reporting a normal task on your to-do list, enabling you to catch subtle trends or sudden, pressing changes.
Regularly checking your HR dashboard and practicing frequent management also help you build your skills when using analytics.
It helps you recognize trends and take action.
With regular maintenance, you can also ensure that each dashboard has a valuable purpose and fits the goals of your leaders and managers.
It may seem obvious, but the more you do something, the better you get, and HR dashboard maintenance is a valuable skill to hone.
3. Use analytics and take action to improve your processes
An HR analytics dashboard displays powerful statistics, but they’re nothing but striking visualizations if you don’t use them to make valuable changes.
Improve your processes by capturing, analyzing, and reporting your HR data, then make impactful change and strategic decisions.
Here are a few HR dashboard examples of taking action with your data:
You discover increasingly high employee turnover rates, then correlate it with other trends in the past months and issue employee pulse surveys to get to the bottom of them.
After implementing a new rewards program, you examine employee engagement and satisfaction levels. These metrics haven’t increased since the program’s introduction, so you take action to adjust the program.
You can take this strategy to the next level by correlating data from candidate assessment software. For example, talent assessments give you accurate data about the skills and competencies of employees.
You can use the data from skills test results with metrics from your performance management system to determine which employees are ready for development.
4. Leverage automated reports to increase efficiency
HR automation helps you streamline the recruitment process and process payroll, and it’s no different with an analytics dashboard.
An HR dashboard already simplifies analytics, but when you increase your use of automation and AI, you experience outstanding productivity.
Set up your integrations to automatically pull data and create reports to increase efficiency, reduce your workload, and ensure everyone can access current data anytime.
We also recommend taking advantage of AI in HR, which many HR dashboards feature.
Here are a few of the top ways to use AI in your dashboard:
Automate dashboard creation based on user prompts
Use predictive analytics to forecast future trends
Review smart suggestions to help you make strategic decisions
Using automation and AI to streamline and optimize your HR functions helps you save time and money so your team can put their effort into meaningful conversations and relationship building.
3 examples of companies succeeding with HR dashboards
Organizations have seen outstanding success by taking advantage of HR metrics dashboards. These tools help businesses correct problematic areas – but stay the course on what works.
Let’s look at three real-life HR dashboard examples to give you inspiration for your own.
F5
MX
Starbucks
F5
F5, an application security company, has been on a long road to technological transformation, building data into its culture as it goes.
It adopted dashboard software back in 2012. Back then, the only departments using it were sales and marketing.
As time passed, more teams saw the value in these dashboards, and data soon became a must-have for strengthening processes and optimizing the entire organization.
Dashboard tools now span HR, finance, manufacturing, IT, customer success, global services, and product teams. F5 attributes a lot of success to these dashboards:
Improved business outcomes
Informed decisions
Increased innovation
HR dashboards help this company discover what it’s doing right and what needs improvement.
Amie Bright, the regional vice president of enterprise data strategy and insights, says that these dashboards have changed F5’s culture in a big way:
“Data has been transforming our corporate culture right in front of our eyes. I feel like every morning, I wake up, and I’m learning something new about data.”
This company recognizes a wealth of opportunities thanks to the clear, visual data that HR dashboard software provides.
MX
MX, a financial data platform, is no stranger to data. Its mission is to help companies turn raw data into valuable assets that deliver better money experiences.
This company uses HR analytics dashboards to level up development programs and increase employee retention. Further, it uses dashboards the same way as employee experience software, improving its workforce’s entire journey.
MX uses a combination of performance metrics and skills to determine how best to grow an employee’s career, looking beyond role-based technical skills and considering cultural and behavioral skills.
It then uses HR dashboards to manage engagement and development for its numerous new hires – it recently doubled its headcount and relied on dashboards to manage these workers.
HR metrics dashboards also helped MX with another crucial part of scaling.
It uses a single reference point so all stakeholders and departments can view data whenever necessary.
Starbucks
Starbucks, the multinational coffeehouse company, uses HR dashboards to monitor its diversity and inclusion in its workforce.
This dashboard is an integral part of the company’s overall DEI strategy, helping it hire, develop, and advance its employees fairly.
However, it’s more than an internal tool – Starbucks uses its HR dashboard as a key component in its CSR strategy.
It publicly displays its diversity and inclusion data on its website, increasing transparency and enabling it to maintain accountability.
This interactive dashboard lets viewers sort Starbucks’ demographics by gender, race, intersectionality, and roles, such as manufacturing, retail, and support.
Users can also shift the dashboard by year, clearly displaying the company’s gradual increase of Black and Hispanic employees.
Make strategic decisions with an HR dashboard
HR dashboard software streamlines data management and lets you view your workforce at a glance.
These dashboards display crucial information, from compensation to performance to gender parity. You can also customize them to show which metrics are essential to your organization.
Choose your HR dashboard and adopt our best practices to get the most out of it. Commit to regular maintenance, integrate as many tools as possible, and correlate multiple data sources to discover detailed information.
If you’re interested in learning more about this topic, read our guide on HRIS systems because HR dashboards are often part of the same package.
Looking for another solid piece of software to pull vital data from?
Watch a live demo of TestGorilla talent assessments, or sign up for a free account today!
HR dashboard FAQs
Let’s finish this guide by answering frequently asked questions about HR dashboards.
What should an HR dashboard include?
An HR dashboard should house, measure, and monitor important HR metrics reports.
The most common dashboards track:
Engagement
Turnover
Performance
Gender parity
Absenteeism
Labor cost
This data is summarized and visualized with charts and graphs, most commonly pie charts and bar charts.
How do I create an HR analytics dashboard?
You can build an HR people analytics dashboard manually in a few steps.
First, decide which key metrics you want to track on this particular dashboard. Then, collect the relevant information from an Excel spreadsheet or another piece of HR software – ensure to connect this tool to your HR dashboard so data is automatically shared and updated.
Use your HR dashboard software to put it all together. Some professionals use Excel to set up their dashboards, but we advise against it because it isn’t the best tool for them, unlike HR dashboard software.
What is an employee dashboard?
Although similar in name to an HR dashboard, the purpose is different. Employee dashboards are employee self-service tools that enable workers to share feedback, ask questions, share peer recognition, and stay up-to-date with company news.
This software empowers employees, increases autonomy, and saves HR teams valuable time by answering simple questions for them.
What is the difference between an HR dashboard and an HR scorecard?
An HR dashboard provides detailed, real-time data and analytics, and an HR scorecard offers the big picture of your company’s performance.
HR dashboards are key for digging deeper into your strategy and discovering specific details. HR scorecards offer a quick way to measure metrics and determine the success of an organization.
Related posts
You've scrolled this far
Why not try TestGorilla for free, and see what happens when you put skills first.
Latest posts
The best advice on pre-employment testing, in your inbox.
No spam. Unsubscribe at any time.

Hire the best. No bias. No stress.
Our screening tests identify the best candidates and make your hiring decisions faster, easier, and bias-free.
Free resources
This checklist covers key features you should look for when choosing a skills testing platform
This resource will help you develop an onboarding checklist for new hires.
How to assess your candidates' attention to detail.
Learn how to get human resources certified through HRCI or SHRM.
Learn how you can improve the level of talent at your company.
Learn how CapitalT reduced hiring bias with online skills assessments.
Learn how to make the resume process more efficient and more effective.
Improve your hiring strategy with these 7 critical recruitment metrics.
Learn how Sukhi decreased time spent reviewing resumes by 83%!
Hire more efficiently with these hacks that 99% of recruiters aren't using.
Make a business case for diversity and inclusion initiatives with this data.


