

The average cost to hire in the US hit $5,475 in 2025, up from $4,700 the year before. It kept climbing into 2026, pushed by rising job board prices and programmatic media costs according to the SHRM 2025 Benchmarking Report.
At the same time, 74% of employers admit they've made a wrong hiring decision. And 59% who hired for AI fluency say they landed someone who couldn't deliver on the job.
So we're spending more. And we're still getting it wrong. This is more than a budget problem. The evidence is getting clearer: it's a measurement problem.
Cost per hire tells you what you spent to get someone through the door. It says nothing about whether that person was worth it. Track CPH without tracking quality of hire, and you optimize the wrong thing. You cut corners on the very process that decides whether you land someone great or someone you'll replace in six months.
The companies that get this right don't just minimize cost per hire. They minimize cost per good hire. This guide covers how to calculate CPH, what the benchmarks mean, and, most importantly, how to use it inside a hiring process that delivers better people, not just cheaper ones.
What is cost per hire?
Cost per hire (CPH) is the average amount your organization spends to recruit and onboard a new employee. It captures both the visible costs (job board fees, recruiter salaries, assessment tools) and the less obvious ones (hiring manager time, compliance processing, onboarding overhead).
You can calculate CPH across the whole company, by department, by role type, or by hiring channel. Each view shows where your recruitment budget is going and how efficiently it's working.
Cost per hire = (Internal recruiting costs + External recruiting costs) ÷ Total number of hires
Internal costs
These are the in-house costs absorbed by your team:
Cost | What it includes |
Hiring manager time | Hours spent reviewing applications, running interviews, and onboarding |
Recruiting staff | Salaries, benefits, and bonuses for your TA team |
Training and development | Ongoing HR staff training |
Compliance | Legal, immigration, and documentation processing |
Administrative overhead | Equipment, office costs, relocation expenses |
External costs
These are costs paid to third parties:
Cost | What it includes |
External recruiters and agencies | Placement fees and agency retainers |
Job board and advertising fees | Paid listings and programmatic media spend |
Assessment and screening tools | Pre-employment testing, background checks |
ATS and HR software | Platform subscriptions |
Referral and signing bonuses | Incentives paid to employees or new hires |
A real-world example
Say your team made 10 hires last quarter.
Internal costs came to $13,500: recruiter salary prorated to these reqs ($7,500), hiring manager and interview panel time ($4,500), and your ATS/recruiting software allocated across the quarter ($1,500).
External costs were $32,500: agency fees ($18,000), job postings and advertising ($6,000), background checks and skills assessments ($4,500), and candidate travel and relocation ($4,000).
Total: $46,000 across 10 hires = $4,600 CPH.
Whether that's good or bad depends on your industry, role type, and, critically, whether those 10 hires are still performing six months later.
What does "average" actually mean?
The national average cost per hire for non-executive roles is $5,475, according to SHRM's 2025 Benchmarking Report. Executive hires cost nearly 7x more, averaging $35,879.
But averages hide a lot. CPH varies sharply by role type and industry:
Role / Industry | Approximate CPH range |
Retail and hospitality (entry-level, high-volume) | |
Manufacturing | |
Public administration, education | |
Healthcare (nurses, physicians) | |
Tech and fintech | |
Executive roles | $35,000+ |
Source: SHRM Talent Acquisition Benchmarking Report (2026), with industry ranges compiled from SHRM and sector data (BLS, Korn Ferry, iCIMS). U.S. figures; varies by role, region, and company size.
Benchmark against your own industry, not the national average. A $9,000 CPH looks alarming next to the $5,475 average. It looks perfectly normal if you're hiring healthcare professionals.
The best insights on HR and recruitment, delivered to your inbox.
Biweekly updates. No spam. Unsubscribe any time.
Why CPH alone will mislead you
Here's the part most CPH guides skip.
A $2,000 cost per hire sounds like a win. Until that $2,000 hire costs you $15,000 to replace six months later, because the process was so stripped back you couldn't tell whether they could actually do the job.
Recruiting is only the down payment. Onboarding and training a new hire adds roughly $4,100 more on average, and most people take months to reach full productivity. So when someone you couldn't properly assess walks out at six months, you're not just re-opening the req. You're writing off the onboarding, the training, and the ramp time you already paid for.
A failed first-year hire lands around $14,900 once you add recruiting, onboarding, training, lost productivity, and starting the search over. The stripped-back process that made your CPH look good is the same reason you couldn't tell whether the person could do the job.
For an early-stage startup, the cash is the least of it. That ~$15,000 is also a quarter of runway you won't get back, a roadmap milestone that slips while the seat sits empty, and a founder or team lead pulled off real work to run the search a second time. That's a delay a small team can't always absorb.
The US Department of Labor estimates a bad hire costs at least 30% of the employee's first-year salary. For a $60,000 role, that's $18,000 in direct damage, before you count lost productivity, team disruption, or the cost of starting the search again.
That's why CPH should never be reviewed in isolation. Pair it with quality of hire (performance ratings, retention at 6 and 12 months) and time to fill, and you get a real picture of whether your hiring process is working. A low CPH with high early attrition isn't efficient hiring. It's deferred cost.
The goal isn't a low number. It's a number that reflects a process that consistently finds people who stay and perform.
How to read your CPH data correctly
Before you optimize, make sure you're reading the metric right. Three things matter here.
Benchmark against the right comparisons. Compare CPH to your own historical trend first, then to industry peers. Broader market conditions, like labor market tightness or job board price shifts, move your CPH in ways that have nothing to do with how well your team operates. In 2025, cost per hire and cost per application rose sharply across the market, driven by job board pricing changes, not recruitment quality. Context stops you misreading normal market movement as an internal failure.
Split by source. An average CPH across all channels hides where the money goes. Run the numbers separately for employee referrals, external agencies, job boards, and direct sourcing. You'll almost always find one or two channels delivering far better cost per good hire than the rest. Employee referral programs, on average, cut both cost and time to hire, and tend to produce candidates who stay longer.
Split by role. Blending every role into one CPH figure buries the signal. A software engineering hire and a customer support hire don't cost the same, and comparing them as if they do tells you nothing you can act on. Calculate CPH for specific roles and departments, then benchmark those figures against industry data for equivalent positions.
The only lever that moves cost and quality
The most effective way to reduce CPH isn't spending less on sourcing. It's improving the quality of your screening, so you spend less time and money on candidates who won't work out.
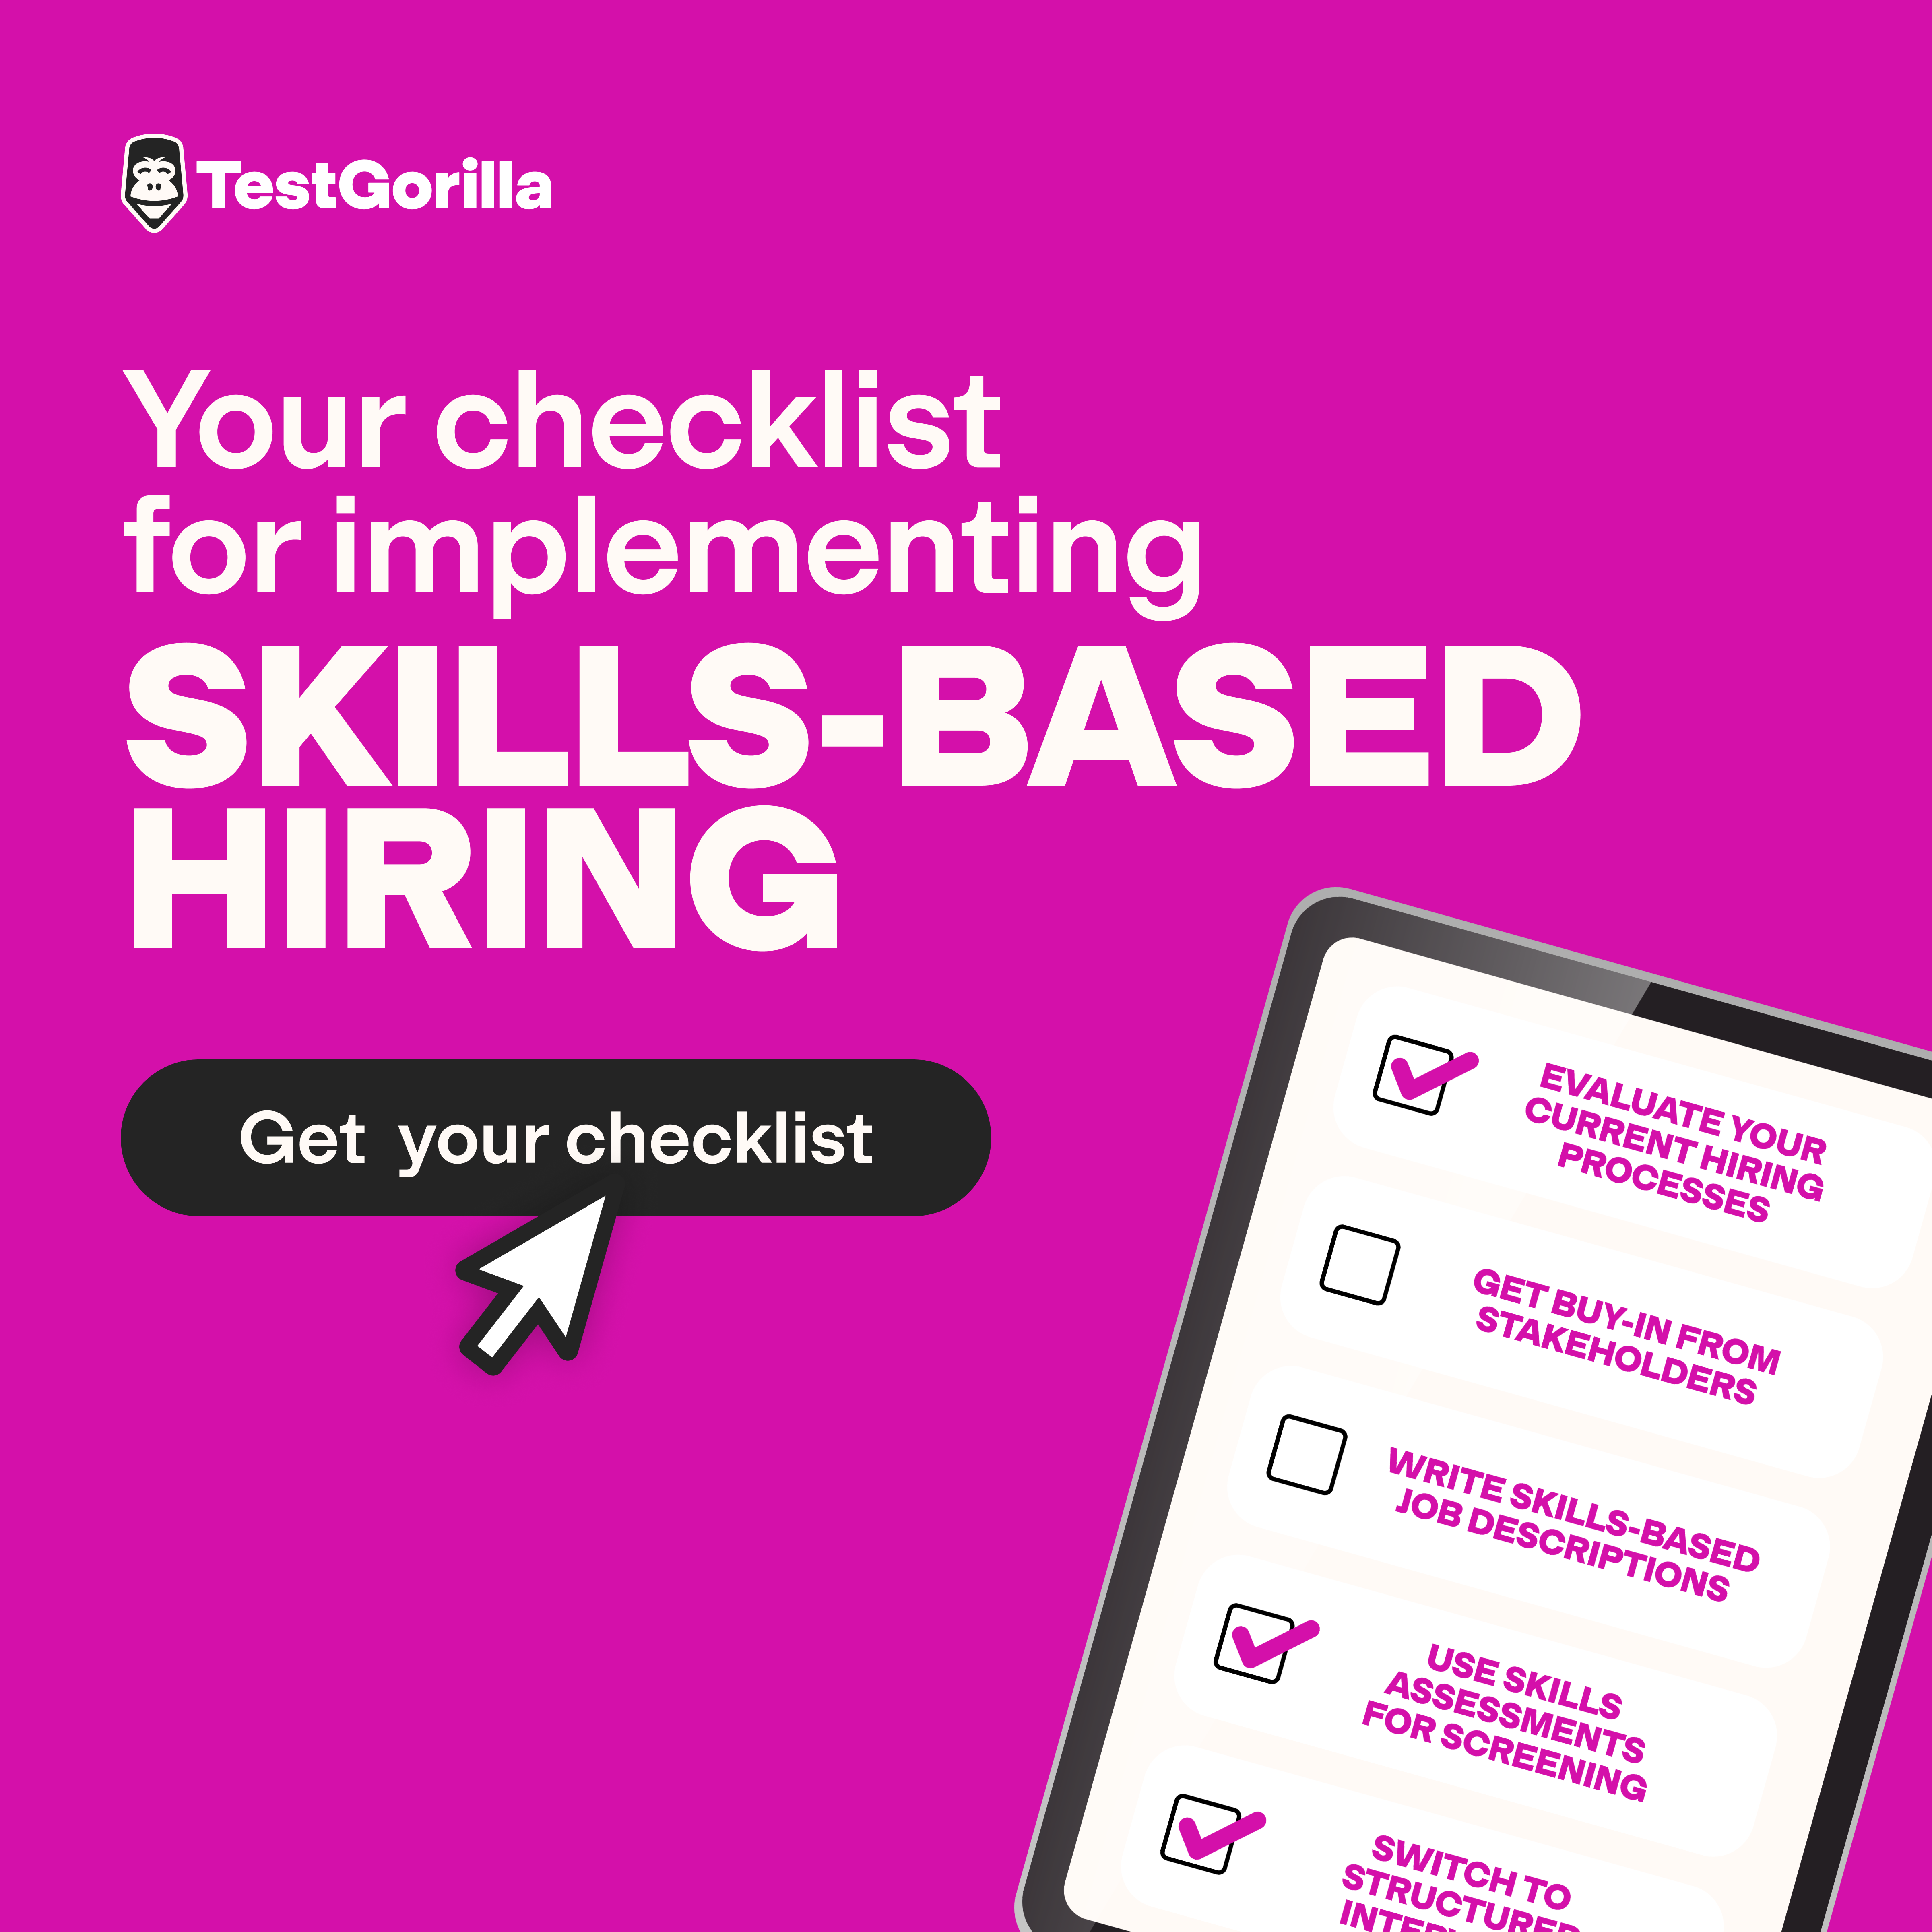
This is where skills-based hiring outperforms traditional approaches. Assess what candidates can actually do, rather than inferring it from CV keywords or pedigree, and you front-load quality decisions before interviews, reduce dependency on expensive recruiters, and cut the back-and-forth that inflates time to fill.
85% of employers now use skills-based hiring. 76% use skills tests specifically, the most widely adopted method. And 53% have eliminated degree requirements entirely, a 77% increase year on year.
The reason is simple: it works. Our research shows skills assessments reduce CPH for most employers who use them, by cutting the volume of unqualified applicants who reach the interview stage, reducing reliance on external agencies, and improving early retention (which lowers the downstream cost of bad hires).
Revolut cut time to hire by 40% after adding skills assessments to their screening process, while improving the overall quality of candidates completing it. Ocean Outdoor UK reduced unsuccessful hires by 44% and saved five interview hours per role.
Skills-based hiring also widens the talent pool. Stop filtering by degree or prior employer, and you reach candidates who'd have been screened out before they could show what they can do.
Other cost-reduction moves worth considering
Referral programs. Existing employees source candidates who understand the culture and tend to onboard faster. Build a structured referral program before you default to agency spend.
Internal mobility. Transferring, redeploying, or promoting existing staff is almost always cheaper than external hiring, and produces better cultural fit. Skills assessments help here too: they let you evaluate internal candidates against a role's actual requirements, rather than relying on seniority or gut instinct.
Targeted sourcing. University partnerships, industry forums, and alumni networks often deliver better candidates at lower cost than broad job board campaigns. Concentrate spend where your best hires have historically come from.
Add context to every CPH movement. A spike in CPH isn't automatically bad. It might reflect an investment in better sourcing ahead of a planned hiring ramp. A drop isn't automatically good. It might mean you've cut the screening step that was catching poor fits. Report the number with an explanation, not in a vacuum.
The culture piece
Skills aren't the whole picture. A candidate with the right capabilities but misaligned values is still a bad hire, and a costly one. Assessments like TestGorilla's Culture Add test surface values and behavioral tendencies, so you can evaluate fit before the offer stage rather than after onboarding.


Cost per hire FAQs
What's the typical cost per hire? The national average for non-executive roles is $5,475, based on SHRM's 2025 Benchmarking Report. Executive roles average $35,879. Both figures vary significantly by industry, role level, and labor market conditions.
Is it cheaper to keep an existing employee than hire a new one? Almost always, yes. Retention is cheaper than replacement, and the gap is wider than most people realize. The US DOL puts the cost of a bad hire at a minimum of 30% of first-year salary. Skills assessments reduce mis-hires, and they help identify internal candidates for open roles, making internal mobility a viable, cheaper alternative to external searches.
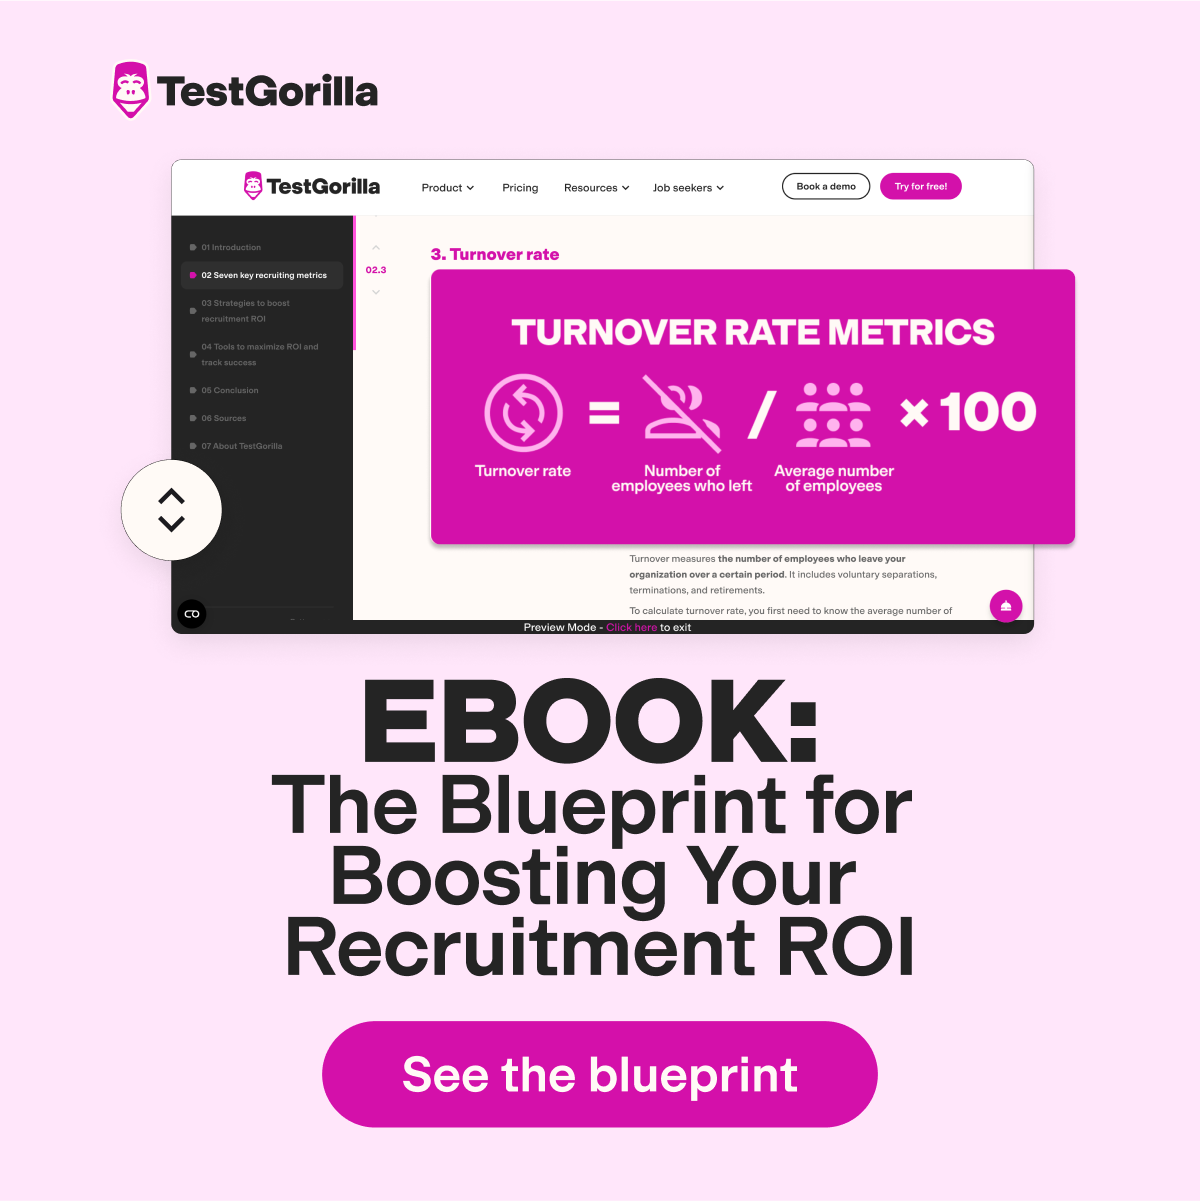
How do I calculate CPH in Excel? List all internal and external recruiting costs in separate columns, including soft costs like hiring manager time. Use SUM to total them, divide by the number of hires in your chosen period, and you have your CPH. For a deeper look at how assessment costs compare to typical CPH reductions and mis-hire savings, see TestGorilla's recruitment ROI guide.
Start measuring what matters
Cost per hire gives you a useful baseline. But it's only useful read alongside quality of hire, and only valuable if the process behind it is built to find people who'll actually succeed in the role.
Skills-based hiring is the lever that moves both numbers. Less screening waste. Fewer mis-hires. Lower downstream costs.
See what better hiring looks like in practice. Start hiring for skills, not cost.
You've scrolled this far
Why not try TestGorilla for free, and see what happens when you put skills first.