Improve your hiring strategy with these 7 important recruiting metrics
Hiring the best employees is a priority for every organization, and successful talent acquisition is still one of the biggest challenges for employers. With studies showing that bad hires can cost businesses $240,000 in expenses, it’s crucial for organizations to start tracking key recruiting metrics and implementing data-driven recruitment strategies.
Good recruiting isn’t as cut and dry as whittling down a candidate pool to find the best hire. It involves evaluating the recruitment and hiring process as a whole, and understanding how certain factors impact the health of your hiring and recruiting strategy.
Recruiting data is a gift to organizations who want to improve on their recruiting efforts and processes. This data comes from measuring recruiting metrics, which help recruiting teams identify where exactly they can make improvements.
Read on to discover seven of the most important recruiting metrics and how to measure them.
Table of contents
Why are recruiting metrics important?
Recruitment metrics help businesses determine how much time and money is spent on specific and distinct recruiting processes, as well as calculate conversion rates at each stage of the recruiting funnel.
Recruiting metrics are more than just numbers. They help steer your organization in the right direction when it comes to making strategic decisions about planning and execution. They can also pinpoint misalignments in your current recruitment process. Most importantly, they help organizations optimize the quality of candidates they hire.
Data-driven recruitment also helps businesses attract and retain the right talent, which in turn supports strategic business objectives.
Here are seven important recruiting metrics to start tracking.
#1 Source of hire
What is source of hire? Source of hire shows what percentage of your overall hires entered your pipeline from each recruiting channel or source. It shows where your recruiting efforts are effective, and where they’re failing to capture quality candidates. It also shows where it’s worth investing more time and money.
Did you know? Employee referrals are generally known for being the strongest source of great hires.
Why it’s important to track: Though employee referrals are one of the most common sources of hire, it might not necessarily be the best source of hire for you. Instead of pouring money into a channel that you’re not sure is working (e.g., employee referrals often have referral bonuses attached to them, job boards often charge a pay-per-click fee for every job seeker that clicks on your job post), take a look at your hiring data to determine where you’ve sourced the majority of your candidates.
Tracking your sources of hires will also allow you to see where you’ve made hires that turned out to not be a good fit for your company. Patterns like these are easy to spot without any complicated analysis.
Analyzing your source of hire data will ultimately help recruiting departments allocate resources to the right channels, measure the effectiveness of their recruiting efforts, and in turn, improve the overall quality of hires.
How to calculate source of hire: # of hires / total # of candidates from a particular source = % of hires from a particular source
#2 Application completion rate
What is application completion rate? This metric shows you how many individuals complete your application form in full.
Did you know? 10.6% of applicants will complete a job application that asks fewer than 25 questions.
Why it’s important to track: Application completion rate helps organizations measure the success of your job opening pitch and application process. Low application completion rates likely mean that there’s an issue with your application process or platform.
In order to make informed decisions on who to invite to interview or move to the next stage in the recruitment process, organizations often ask a high volume of questions. However, job applicants sometimes consider job application forms to be too lengthy or tedious, or that they require duplicate information. In short, job application forms are often not very user-friendly.
This metric helps you identify where and why applicants drop out of the process. Modifying your application processes will help you improve your application completion rate and prevent potential candidates from backing out at the first hurdle.
To help optimize the number of people completing application forms, ask them to complete a pre-hiring skills test alongside a shortened version of the application form for more informative and relevant results.
How to calculate application completion rate: # of submitted job applications / Total # of job applications started = application completion rate
#3 Turnover rate
What is turnover rate? Turnover rate measures the rate at which employees depart from your company within a certain amount of time.
Did you know? Over 60% of turnover is voluntary.
Why it’s important to track: A high employee turnover rate is an expensive and time-consuming problem for organizations. First, new hires need to be hired to replace old ones, and new hires need to be trained and onboarded. Secondly, the costs involved with replacing departed employees are high. Additionally, the longer a job vacancy stays open, the higher the costs for the business.
Measuring your turnover rate helps you:
Identify specific departments or managers that have the highest turnover
Pinpoint whether most turnover happens at a specific time of the year
Determine whether there’s a common source of hire for most voluntary turnover
It’s important for organizations to conduct exit interviews with departing employees to gather feedback on their decision to leave their position. These details can also help organizations adjust their recruiting strategies accordingly.
How to calculate turnover rate: # of employees left / average number of employees x 100 = monthly/annual turnover rate
#4 Offer acceptance rate
What is offer acceptance rate? Offer acceptance rate shows you what percentage of candidates accepted your job offers.
Did you know? The average offer acceptance rate is 94% across industries — the rest will reject your offer after going through almost a full recruiting cycle.
Why it’s important to track: Offer acceptance rates show you how attractive and competitive your job offers are. This metric also highlights how well you can identify the correct needs and/or deal breakers for your candidates before you extend an offer.
If your offer acceptance rate is lower than the 94% benchmark, it’s very likely that your candidates aren’t satisfied with certain aspects of your offer, such as:
Compensation offered
Benefits offered, such as paid time off, health benefits, work from home flexibility, etc
Long probationary period
Other times, candidates reject offers because of a poor candidate experience, or, simply, they received a better offer from another company.
How to calculate offer acceptance rate: # of accepted job offers / # of total offers extended = offer acceptance rate
#5 Quality of hire
What is quality of hire? Quality of hire determines the value a new hire adds to your company.
Did you know? Measuring and understanding quality of hire is a priority for almost 40% of organizations.
Why it’s important to track: Quality of hire is one of the more complex metrics to track, but one of the most important, too, as the results of this metric directly correlate to an employee’s return on investment and contribution to a company’s success.
In terms of calculating quality of hire, this is up to each individual organization and how they wish to benchmark quality. There is no one-size-fits-all approach to this metric, but some common indicators include:
Retention rate
Performance reviews
360-degree feedback results
Productivity or goals achieved
Other factors can help you predict the quality of hire before they become an employee, too. For example, candidates who score well on pre-employment tests are more likely to be successful hires.
How to calculate quality of hire: Quality is more difficult to accurately calculate, but employee performance metrics and retention and turnover metrics can help you evaluate the strength and quality of candidates.
#6 Applicant to interview
What is the applicant to interview rate? The applicant to interview rate measures how many of your applicants you move to the interview stage.
Did you know? The average percentage of applicants who move forward to the interview stage rate is 12%. According to Jobvite, that means out of 8 applicants, only 1 will get an interview.
Why it’s important to track: This metric measures the health of your candidate screening processes. If you move too many candidates forward to interview, it’s likely that you’re spending too much time narrowing down your candidate pools, and your job description may need tweaking. If you’re interviewing too many candidates, you may not be qualifying your candidates prior to interview.
Recruiting solutions such as applicant tracking systems can automatically screen and parse resumes, saving you time on screening, while pre-employment tests can also help you make a more well-rounded decision on which applicants to invite to interview.
How to calculate applicant to interview: There’s no magic calculation here. Generally speaking, 3-5 candidates for first round interviews, and 2-3 candidates for second round interviews are solid numbers to aim for.
#7 Interview to offer
What is the interview to offer rate? The interview to offer rate measures the number of job offers extended, relative to the number of job interviews that have been held.
Did you know? The average percentage of interviews that lead to offers is 28%. According to Jobvite, for every 3.5 people you interview, you’ll extend one offer.
Why it’s important to track: The interview to offer rate helps you evaluate the quality of the candidates you move forward to interview. If you’re not making many offers but holding many interviews, you need to ask yourself why you’re moving so many unsuitable candidates to the interview stages.
How to calculate interview to offer: This can be worked out as a simple ratio. For example, if a business interviews 20 candidates and extends 2 job offers, the interview to offer ratio is 1:10.
Measuring for recruiting success
If you want better recruiting results, you’ll likely have to make changes within your recruiting processes. Though there are dozens of recruiting metrics to choose from, measuring these seven metrics will help you pinpoint areas for improvement across the recruiting process, from the beginning to end.
HR and recruitment departments have generally been quite slow in using metrics to measure process performance and identify areas for improvement, often because identifying the right set of key metrics to effectively measure recruiting success and failure can be daunting.
However, most HR software solutions now also offer dashboard functionality that can help you keep an eye on these metrics.
The results of these metrics will help you see what’s working and identify areas for improvement
Related posts
You've scrolled this far
Why not try TestGorilla for free, and see what happens when you put skills first.
Latest posts
The best advice on pre-employment testing, in your inbox.
No spam. Unsubscribe at any time.

Hire the best. No bias. No stress.
Our screening tests identify the best candidates and make your hiring decisions faster, easier, and bias-free.
Free resources
A step-by-step blueprint that will help you maximize the benefits of skills-based hiring from faster time-to-hire to improved employee retention.
With our onboarding email templates, you'll reduce first-day jitters, boost confidence, and create a seamless experience for your new hires.
This handbook provides actionable insights, use cases, data, and tools to help you implement skills-based hiring for optimal success
A comprehensive guide packed with detailed strategies, timelines, and best practices — to help you build a seamless onboarding plan.
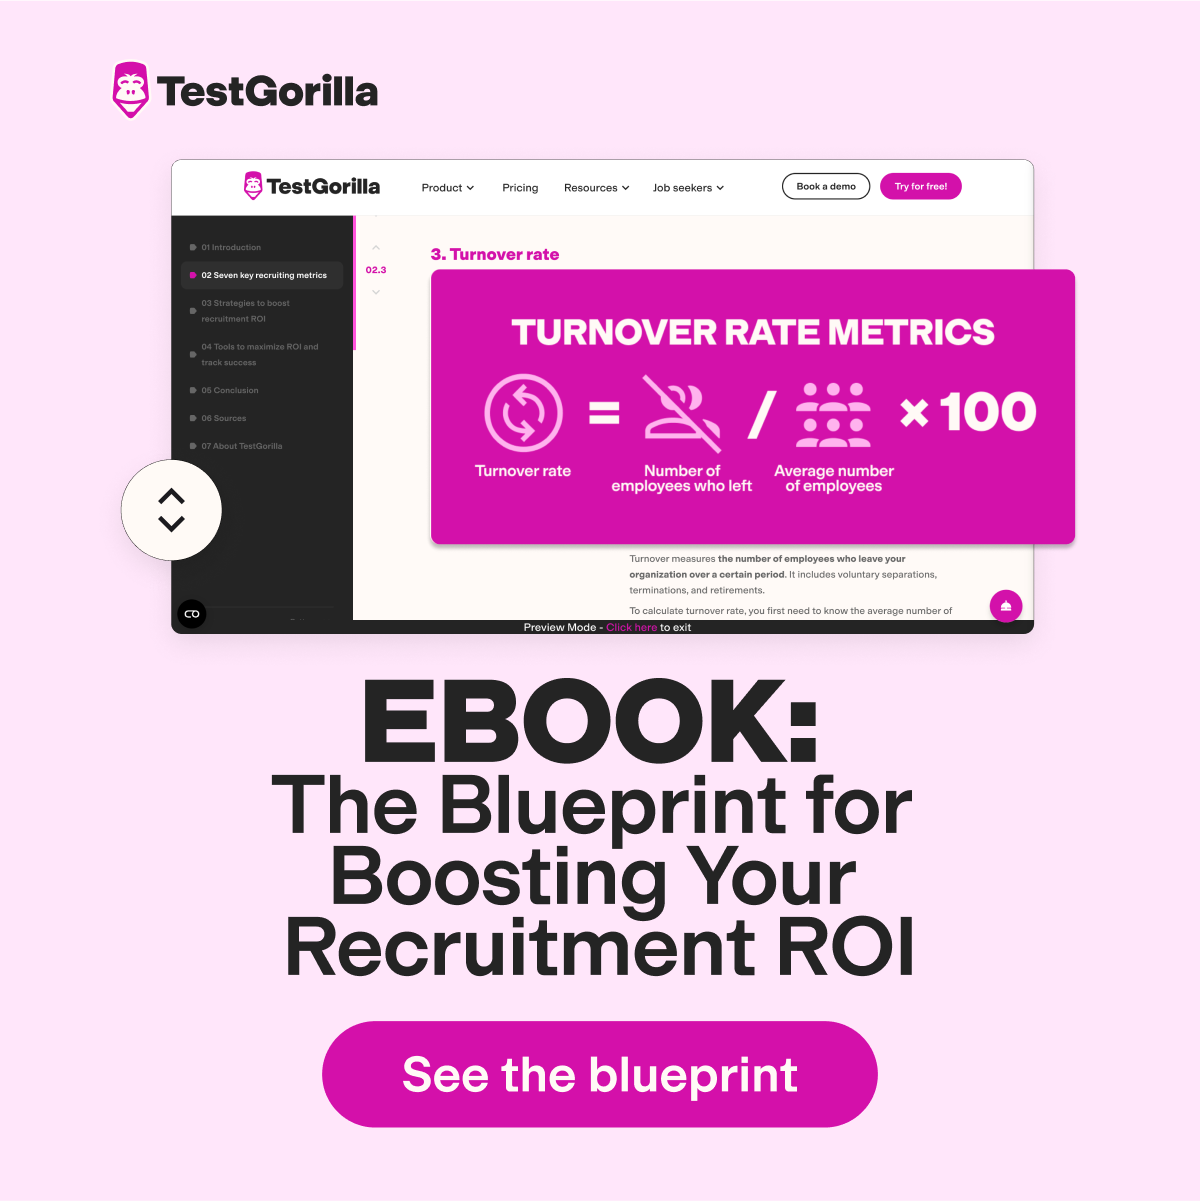
This in-depth guide includes tools, metrics, and a step-by-step plan for tracking and boosting your recruitment ROI.
Get all the essentials of HR in one place! This cheat sheet covers KPIs, roles, talent acquisition, compliance, performance management, and more to boost your HR expertise.
Onboarding employees can be a challenge. This checklist provides detailed best practices broken down by days, weeks, and months after joining.
Track all the critical calculations that contribute to your recruitment process and find out how to optimize them with this cheat sheet.


